Reporting & Analytics

Analysing the Swedish krona Short-Term Rate (SWESTR) Development using Power BI

Blog

Analysing the Swedish krona Short-Term Rate (SWESTR) development using Power BI

The Swedish krona Short-Term Rate (SWESTR) is a reference rate, meaning that it can be used as a reference for setting rates between banks. The SWESTR is completely based on transactions happening in the market and is published every bank day at Riksbanken’s website. It is intended to be used for loans with the shortest term, for example as a so called over-night rate (O/N rate) or tomorrow-next rate (T/N rate). For more information about SWESTR, please refer to this interview with a Riksbank representative.

Reading data to Power BI using a REST API

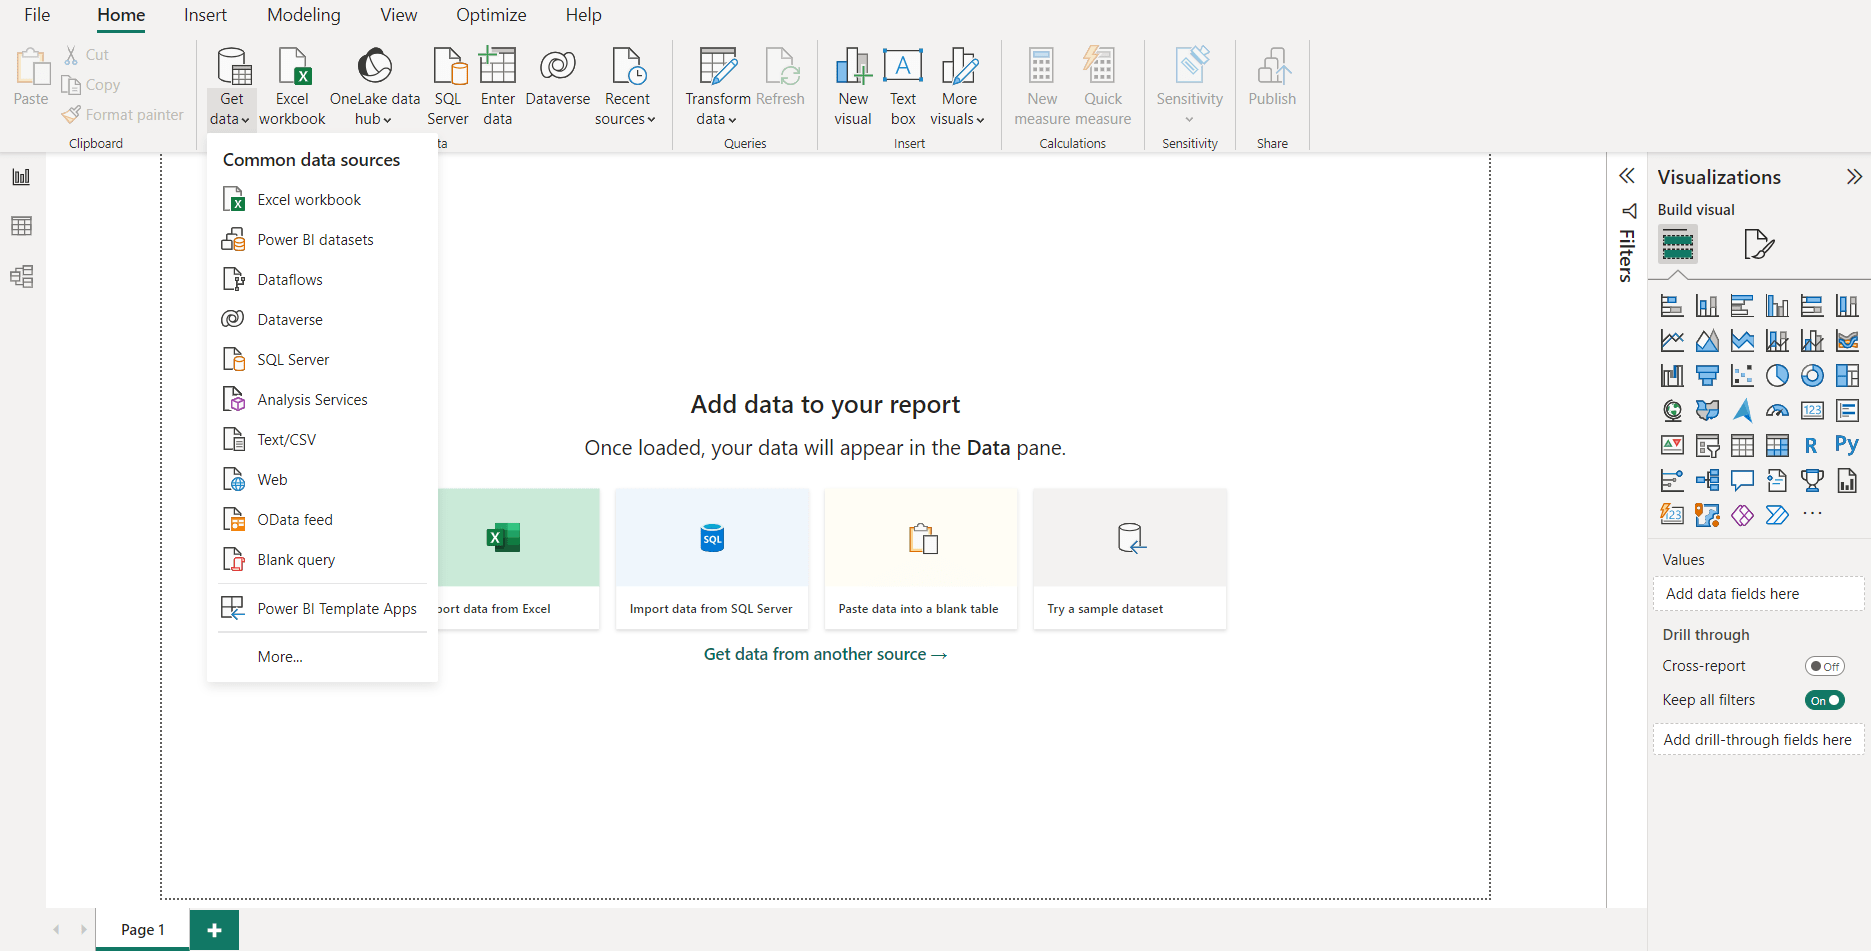
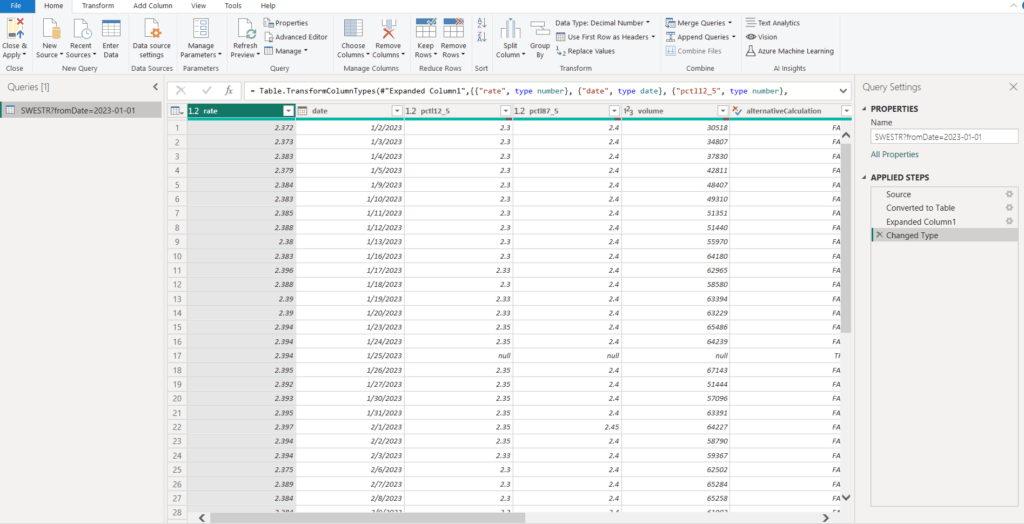
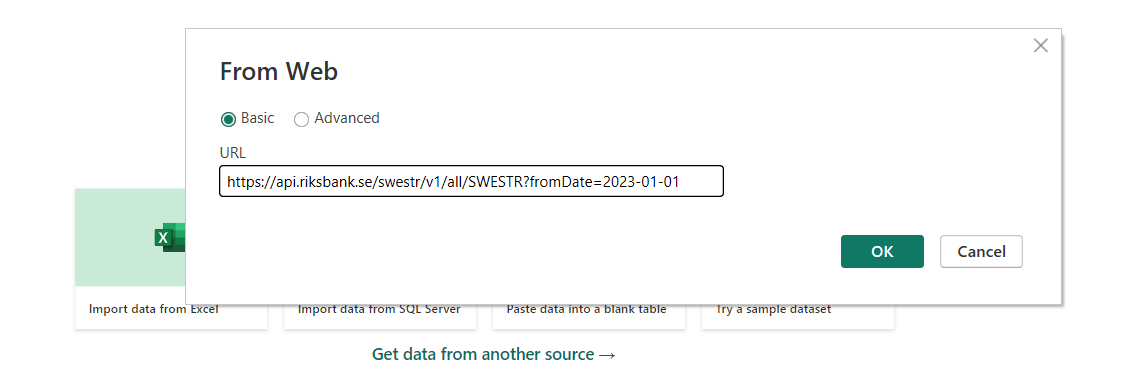
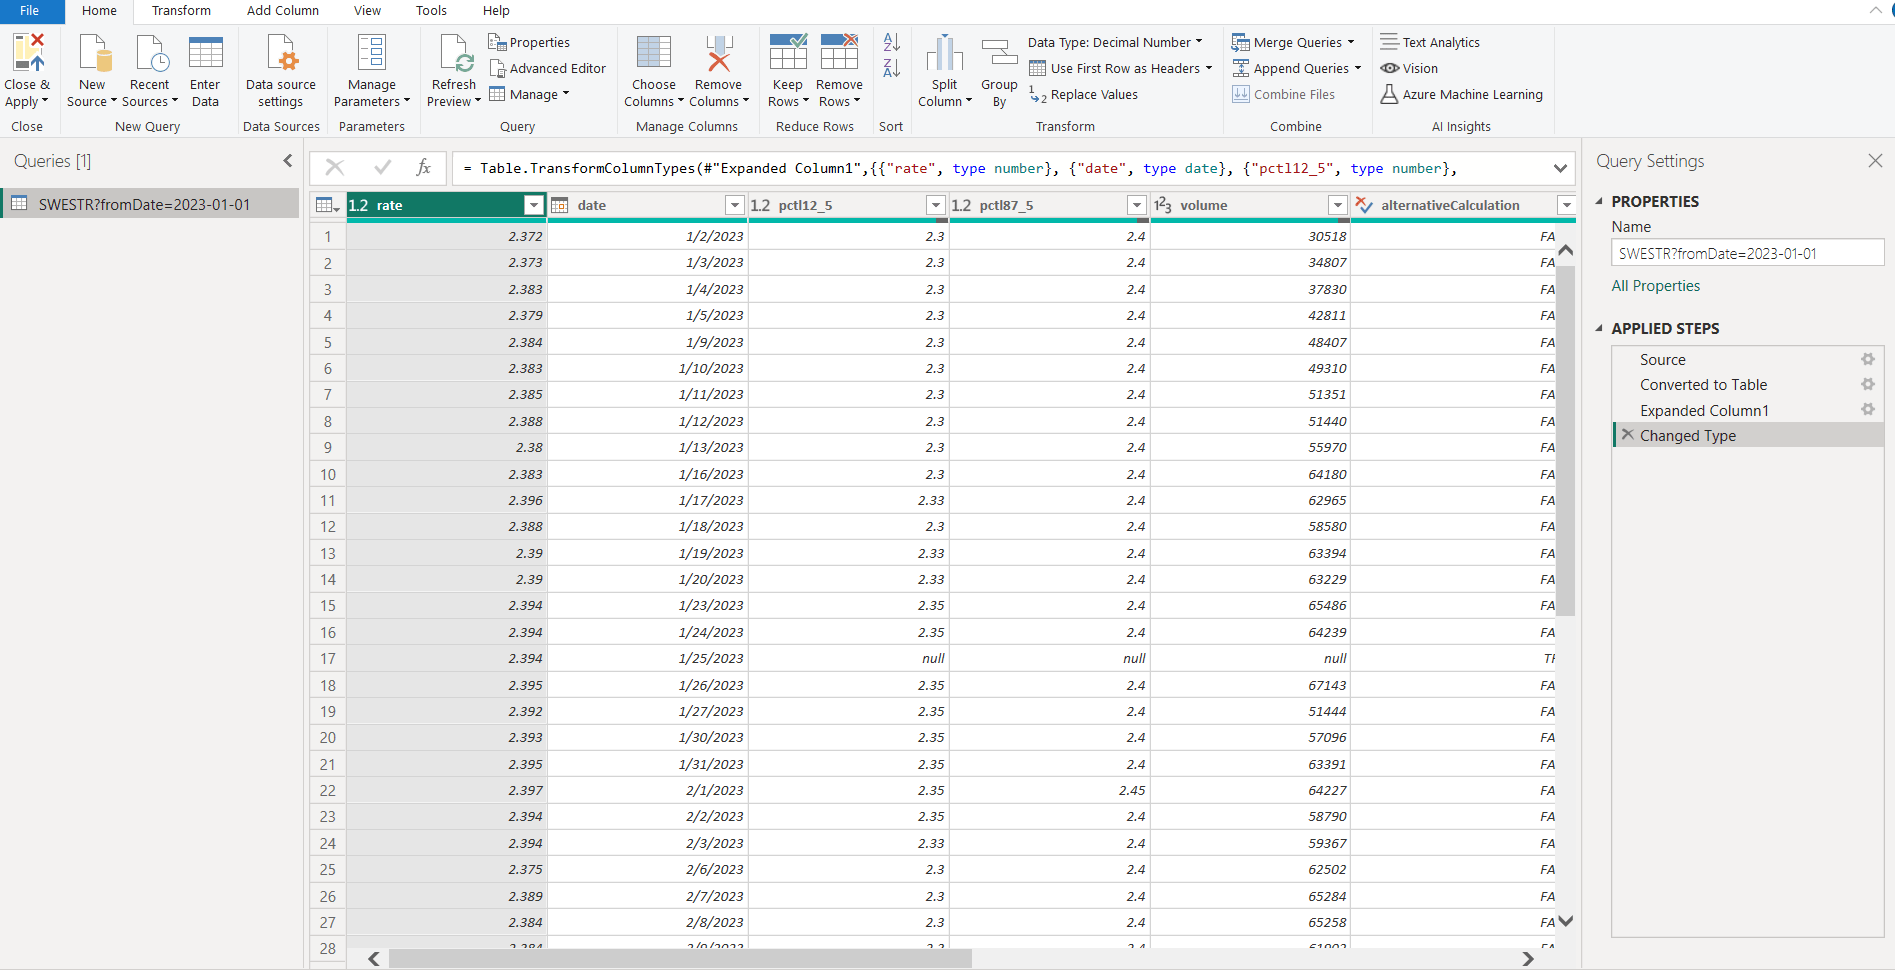
The SWESTR went live in September 2021. Data is published each bank day and contains for example the current SWESTR rate, the volume and number of transactions. The data can be read by utilising the Riksbank’s REST API. In a previous blog post, we guided readers on how to read SWESTR data to Power BI via the REST API. 

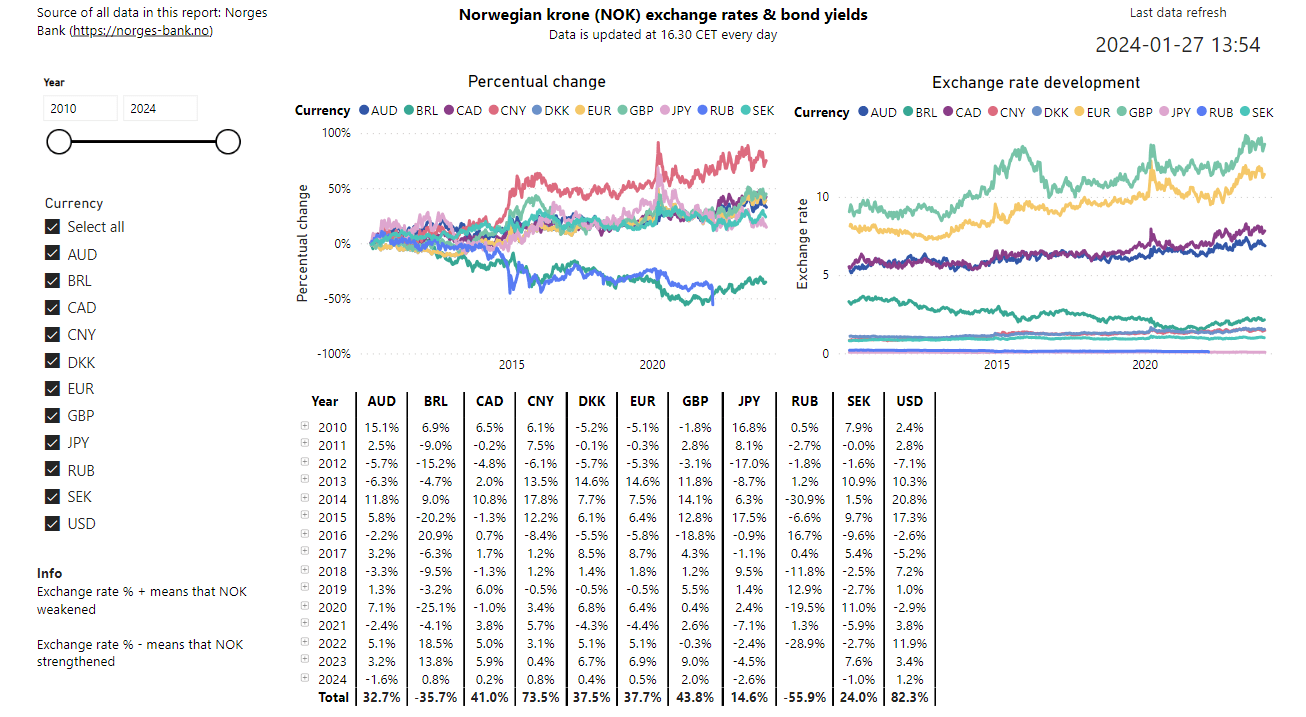
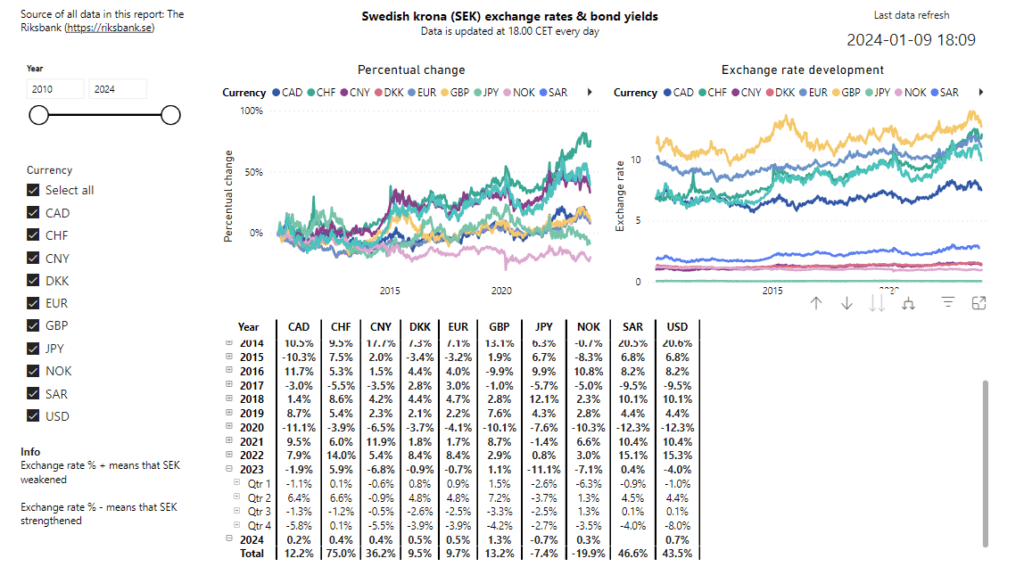
Our report, called Report of Swedish krona Short-Term Rate (SWESTR), reads the data directly to Power BI by using the REST API. Below is a picture of the report, available in our Portfolio, which we will now analyse further.

Power BI report showing SWESTR data

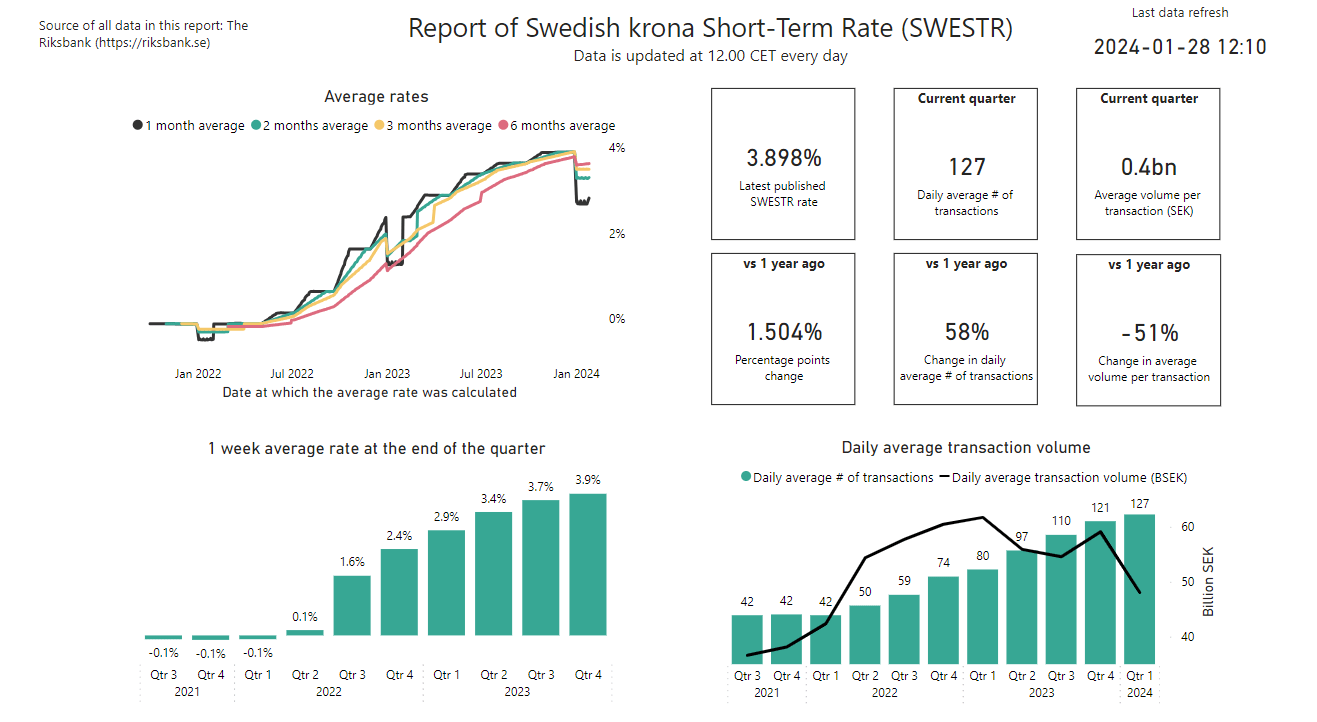
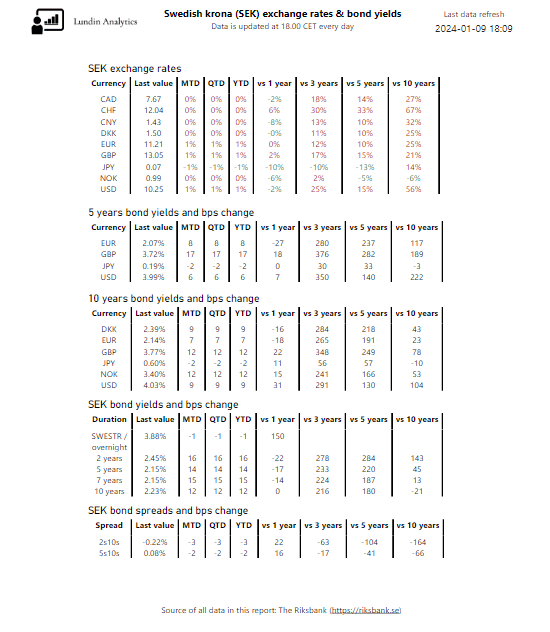
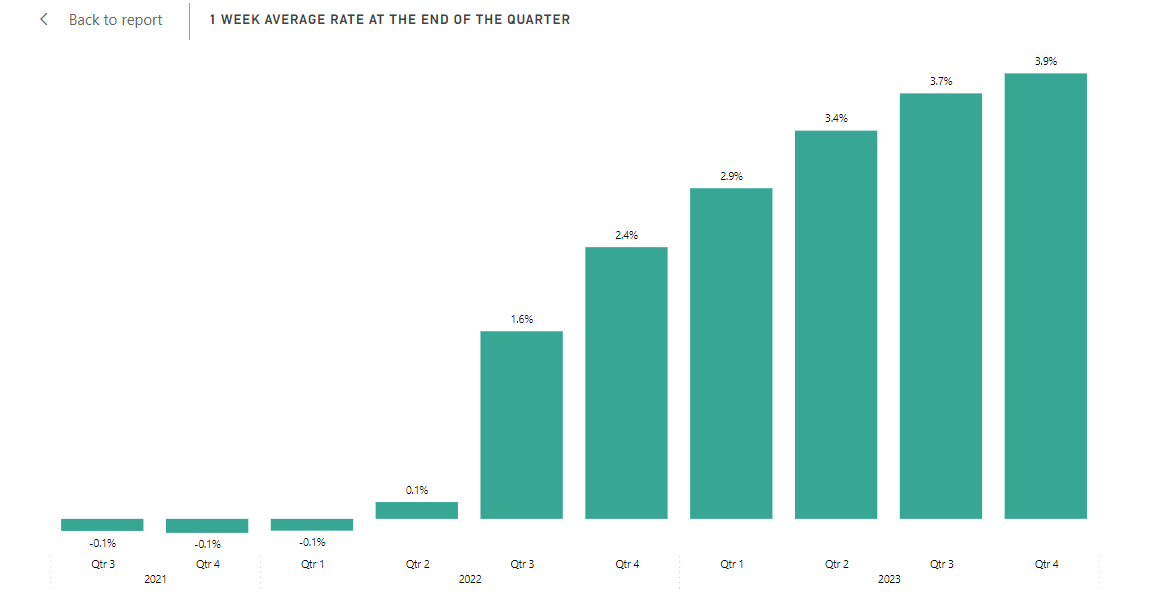
It can be seen that since the launch in Q3 2021, the rate has increased much. In order to reduce the noise of potentially low/high values, we present averages in our charts. For example the 1 week average rate, seen in the chart below, is the average rate for that week. The 1 week average, hence roughly also the SWESTR itself, has increased from -0.1% at the end of Q3 2021 to 3.9% at the end of Q4 2023. That is a dramatic increase of around 400 basis points (bps) in approximately 2 years.

1 week average SWESTR at the end of each quarter

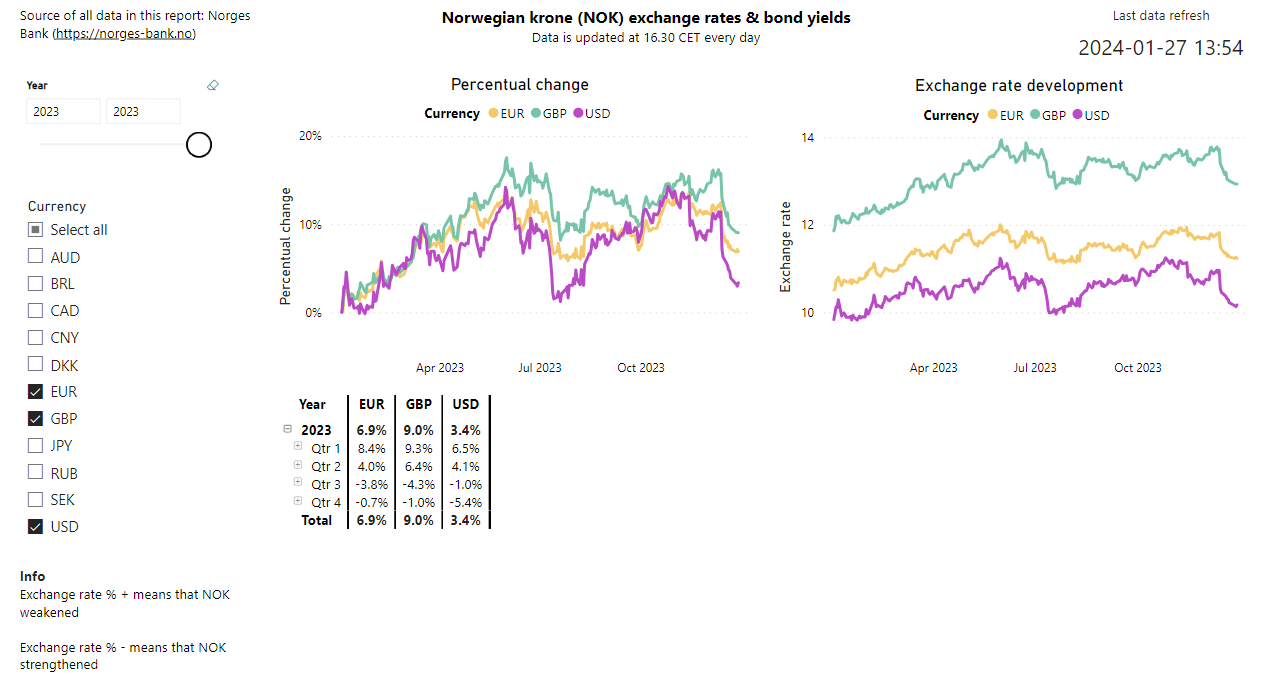
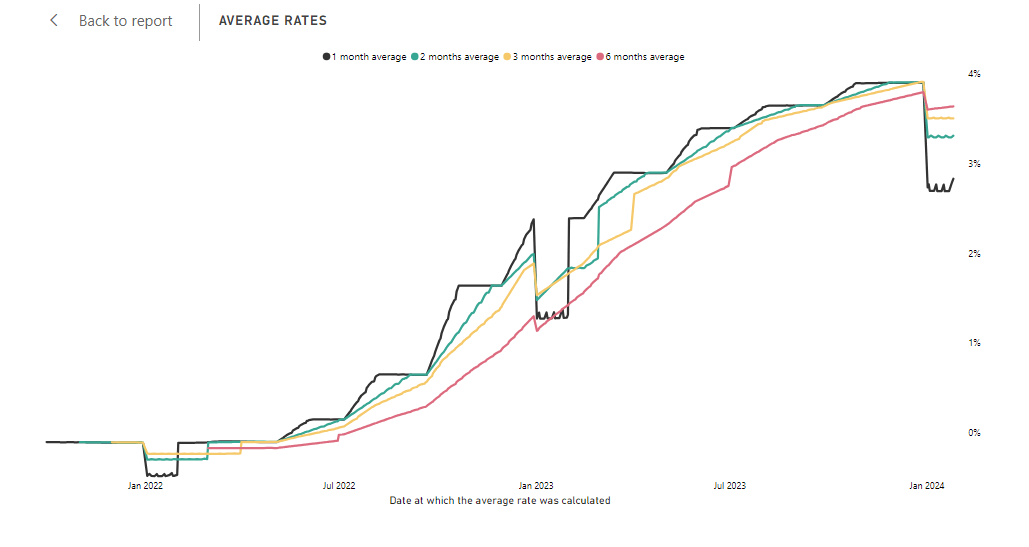
We also present the latest published SWESTR rate – at the time of writing this, it is 3.898%. That is 150 bps higher than 1 year ago, which is also a quite dramatic increase. Similarly to the 1 week average, we also present the averages calculated over longer time periods (1 – 6 monhts), which can be seen in the chart below. Naturally, the 6 months average will be “slower” and have less noise. It can be seen that all the four averages converged at the end of 2023, which means that the SWESTR value has been flat for some time.

Average SWESTR rate
Average SWESTR rate

SWESTR performance metrics

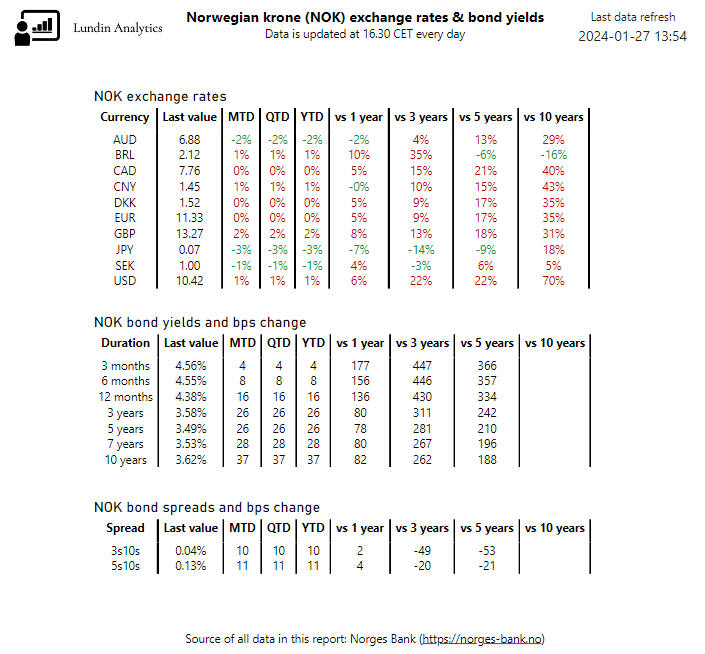
The volume, in terms of SEK per day, and the number of transactions per day, are also presented as can be seen in the chart below.

SWESTR volume and transactions per day

It seems that the SWESTR is gaining in popularity. It started out in Q3 2021 with on average 42 transactions per day. The average volume per day was 36.6 billion SEK. On average, this gives approximately 870 million SEK per transaction. The Riksbank then considers all of these transactions and calculates the rate to be used the next day for new transactions. In Q1 2024, there are so far 127 transactions per day – an increase of more than 200% since the launch. The average volume per day is 48.0 billion SEK, which is an increase of approximately 30% since the launch. However, this corresponds to on average 378 million SEK per transaction, which is a decrease of 57% since the launch. To summarise, the volume performance since launch is:

  • Transactions per day: 42 to 127 (appr. +202%)
  • Volume per day: 36.6 BSEK to 48.0 BSEK (appr. +31%)
  • Volume per transaction: 870 MSEK to 378 MSEK (appr. -57%)

So, to summarise, many more but smaller transactions happen each day. The overall daily volume has substantially increased (+11.4 BSEK) as well.

Going back to the chart with the (average) rate at the end of each quarter, we see a massive rate increase in Q3 2022, which is approximately when central banks started to raise interest rates. The SWESTR went from 0.1 to 1.6% in just one quarter. The next quarter it increased by 0.8%, which is also a large increase. In the recent quarters, however, the rate is becoming more stable. In Q4 2023, it just increased by 0.2%. We can also note that the latest SWESTR (3.898%) is actually below or the same as the average of 3.9% at the end of 2023. So, if this continues for the rest of the quarter, we will see a “peak” of the rate in Q1 2024.

In this post, we have effectively used fundamental data analytics principles, to look at the SWESTR performance from many angles – latest rate (“price”), monetary volume and number of transactions. For example the monetary volume is important both for large and small financial actors and investors. If the volume is too large for an actor, the actor might not be confident that the SWESTR is an appropriate rate. On the other hand, if there is too little volume, large actors/investors might not want to use it for their transactions as it gives too little insight to their pricing case. Their transactions could also make up a large portion of the SWESTR volume which is not a desirable property of a reference rate. Finally, we have also reviewed several averages from 2021 to 2024, and the overall volume development since launch, to get some historical background as well.

More blog posts

On the development of the SEK exchange rates & bond yields in Q3 2025

We analyse the development of the SEK exchange rates & bond yields in Q3 2025. We use a Power BI...

On the development of SWESTR in Q3 2025

We analyse the development of the SWESTR in Q3 2025. We use a Power BI report and also review the...

Reading monetary policy data from the Riksbank via REST API

We analyse the development of the SWESTR in May 2024. We use a Power BI report and also review the...

On the development of SWESTR in May 2024

We analyse the development of the SWESTR in May 2024. We use a Power BI report and also review the...

On the development of the SEK exchange rates & bond yields in May 2024

We analyse the development of the SEK exchange rates & bond yields in May 2024. We use a Power BI...

On the development of the SEK exchange rates & bond yields in April 2024

We analyse the development of the SEK exchange rates & bond yields in April 2024. We use a Power BI...

On the development of the NOK exchange rates & bond yields in March and Q1 2024

We analyse the development of the NOK exchange rates & bond yields in March and Q1 2024. We use a...

On the development of SWESTR in March and Q1 2024

We analyse the development of the SWESTR in March and Q1 2024. We use a Power BI report and also...

On the development of the SEK exchange rates & bond yields in March and Q1 2024

We analyse the development of the SEK exchange rates & bond yields in March and Q1 2024. We use a...

Analysing the Swedish krona Short-Term Rate (SWESTR) Development using Power BI Read More »

A closer look at the NOK exchange rate development using Power BI

Blog

A closer look at the NOK exchange rate development using Power BI

In this blog post, we will elaborate on the Norwegian krone (NOK) exchange rate development by using Power BI. In our Portfolio, we have built a report which presents NOK exchange rates and bond yields. The data is read from Norges Bank directly to Power BI using their REST API. REST API stands for REpresentational State Transfer API, and it is a common way of structuring and accessing data in a programmatic way.

Introduction to the Power BI report

Our report, called Norwegian krone (NOK) exchange rate & bond yields, presents the NOK performance against an array of currencies. For example, the NOK exchange rate against Canadian Dollar (CAD), Euro (EUR) and US Dollar (USD) are presented. In addition, the NOK bond yields for the government bonds are presented. Finally, the so called “bond spreads” are presented. Bond spread refers to the difference in yield between a short-term bond and a long-term bond. More information about bond spreads is found below.

To start with, the user can compare the percentual and actual development of exchange rates. It is possible to select which currency to compare with, and the time interval can be selected. In our report, we have decided to read data starting from Jauary 2010, but Norges Bank provides data even earlier than that. Monthly and quarterly changes are presented in the matrix for each currency which can be seen below.

NOK exchange rate
NOK exchange rate development since 2010

NOK performance highlights

The total development since 2010 is presented and some highlights are:

  • NOK has strengthened vs BRL (Brazilian real) by 36%
  • NOK has weakened vs GBP by 44%
  • NOK has weakened vs USD by 82%

To further zoom in on the performance, in the picture below, we have filtered the page on the year 2023 and only selected EUR, GBP and USD for analysis.

NOK exchange rate
NOK exchange rate development in 2023 with comparisons against EUR, GBP and USD

To give the user some background on the exchange rates development, we also present bond yields and bond spreads. For example, increases in the NOK government bond yields might correlate with a stronger NOK and vice versa.

Bond spreads

The bond spread is an important measure, as it typically tells how much of a premium you can get by lending your money for a longer time span. For example, if the 3 years bond yield is 3.0% and the 10 years yield is also 3.0%, investors might think there is no reason to “lock” the money for 10 years and could rather go for the shorter time span. On the other hand, a large bond spread, which could happen if the 3 years yield is at 3.0% and the 10 years yield is at 5.0%, could indicate that there are large risks with the 10 years yield, which could scare investors.

Summary page in Power BI

We present a summary page with NOK exchange rates and an extensive summary of NOK bond yields. The durations of the bonds span from 3 months all the way to 10 years. Finally, we present bond spreads in terms of differences between the 10 years yield and the 3/5 years yields. The development is evaluated in many different time periods, for example quarter-to-date (QTD), vs 5 years ago and vs 10 years ago. Hence, it gives a compressed historical view as well as an emphasis on the current values. It is an efficient Power BI visualisation which provides an overview of the most important measures with regards to exchange rates and bond yields development.

NOK exchange rates & bond yields

For more information on how Norges Bank shares open data, for example related to exchange rates, securities and interest rates, please see their website.

More blog posts

On the development of the SEK exchange rates & bond yields in Q3 2025

We analyse the development of the SEK exchange rates & bond yields in Q3 2025. We use a Power BI...

On the development of SWESTR in Q3 2025

We analyse the development of the SWESTR in Q3 2025. We use a Power BI report and also review the...

Reading monetary policy data from the Riksbank via REST API

We analyse the development of the SWESTR in May 2024. We use a Power BI report and also review the...

On the development of SWESTR in May 2024

We analyse the development of the SWESTR in May 2024. We use a Power BI report and also review the...

On the development of the SEK exchange rates & bond yields in May 2024

We analyse the development of the SEK exchange rates & bond yields in May 2024. We use a Power BI...

On the development of the SEK exchange rates & bond yields in April 2024

We analyse the development of the SEK exchange rates & bond yields in April 2024. We use a Power BI...

On the development of the NOK exchange rates & bond yields in March and Q1 2024

We analyse the development of the NOK exchange rates & bond yields in March and Q1 2024. We use a...

On the development of SWESTR in March and Q1 2024

We analyse the development of the SWESTR in March and Q1 2024. We use a Power BI report and also...

On the development of the SEK exchange rates & bond yields in March and Q1 2024

We analyse the development of the SEK exchange rates & bond yields in March and Q1 2024. We use a...

A closer look at the NOK exchange rate development using Power BI Read More »

How to read Norwegian krone (NOK) exchange rate data to Power BI

Blog

How to read Norwegian krone (NOK) exchange rate data to Power BI

In this blog post, we are going to explain how to read data from Norges Bank to Power BI. We have done so in one of our reports, available in our Portfolio. The report reads data from Norges Bank directly to Power BI. We do so by utilising their REST API, which provides open data. REST API stands for REpresentational State Transfer API, and it is a common way of structuring and accessing data in a programmatic way.

Sometimes, there can be security measures applied to the REST API. In the case of Norges Bank’s API, there are no security measures so the API is fully open. If you are an API developer and wants to earn money by providing an API, you typically make the users pay for access to the API, and security measures make it impossible to reach for non-paying users.

The user starts by going to Get Data in Power BI, which is going to look like this. Then the user selects “Web” in the list presented.

Get Data Power BI


From Norges Bank’s website, we select that we want to read the USD exchange rate from 1st January 2023 until 24th January 2024. We also select that we want to read by API, and we then get the following message.

Norges Bank’s website provides options for how to read from the API

The URL listed is:

https://data.norges-bank.no/api/data/EXR/B.USD.NOK.SP?format=csv&startPeriod=2023-01-01&endPeriod=2024-01-24&locale=en

Here, EXR means Exchange rate and USD.NOK means that we want to read the USD-NOK exchange rate. We have selected a csv format and the start period and end period are visible in the URL. We simply add this URL to the URL field in Power BI which will look like below.

Get Data in Power BI

The user now gets the data from January 2023 in return. Each row of the data is the data for that day, in this case it is the exchange rate at that day.

Depending on the use case, it might be better to formulate requests that do not read all the data at once. For example, the report can have a button to refresh data depending on user selection. Then the user might select 2015 – 2024, and that request can then be sent to the API. This can be a nice solution if there are many potential API requests. Instead of reading all of these, they can be created dynamically. For example, Norges Bank has a section in their data warehouse where they provide Norwegian government securities – Prices and yields. Here, there are many Securities which can be seen below.

Securities at Norges Bank's website
Securities at Norges Bank’s website

They can also be read with different Frequencies and Measurement units. It creates many combinations, so it can be a good idea to dynamically create such request depending on the user selection, rather than to pre-read all of them. In this report, however, it is straightforward and all the currency data is read from 2010.

Finally, the data will look like this in Power BI and now it is time to visualise the data in a meaningful way.

Preview of the data

For more information on how Norges Bank shares open data, for example related to exchange rates, securities and interest rates, please see their website.

More blog posts

On the development of the SEK exchange rates & bond yields in Q3 2025

We analyse the development of the SEK exchange rates & bond yields in Q3 2025. We use a Power BI...

On the development of SWESTR in Q3 2025

We analyse the development of the SWESTR in Q3 2025. We use a Power BI report and also review the...

Reading monetary policy data from the Riksbank via REST API

We analyse the development of the SWESTR in May 2024. We use a Power BI report and also review the...

On the development of SWESTR in May 2024

We analyse the development of the SWESTR in May 2024. We use a Power BI report and also review the...

On the development of the SEK exchange rates & bond yields in May 2024

We analyse the development of the SEK exchange rates & bond yields in May 2024. We use a Power BI...

On the development of the SEK exchange rates & bond yields in April 2024

We analyse the development of the SEK exchange rates & bond yields in April 2024. We use a Power BI...

On the development of the NOK exchange rates & bond yields in March and Q1 2024

We analyse the development of the NOK exchange rates & bond yields in March and Q1 2024. We use a...

On the development of SWESTR in March and Q1 2024

We analyse the development of the SWESTR in March and Q1 2024. We use a Power BI report and also...

On the development of the SEK exchange rates & bond yields in March and Q1 2024

We analyse the development of the SEK exchange rates & bond yields in March and Q1 2024. We use a...

How to read Norwegian krone (NOK) exchange rate data to Power BI Read More »

A closer look at the SEK exchange rate development using Power BI

Blog

A closer look at the SEK exchange rate development using Power BI

In this blog post, we are going to go behind the scenes of the development of two reports available in our Portfolio. These reports read data from the Swedish central bank – the Riksbank – directly to Power BI. We do so by utilising the REST APIs provided by the Riksbank. REST API stands for REpresentational State Transfer API, and it is a common way of structuring and accessing data in a programmatic way.

Background on REST APIs

Some REST APIs have security measures in place, so that only authorised users can access the data. The user then has to send credentials by using the API, and if they are verified correctly, data can be read. With the Riksbank’s API it is not required with credentials. Hence, this guide is going to skip that part, and we are only reading, not writing, data when using the API. We are going to access interest rates for the SWESTR which is a reference rate with short duration (overnight rate). For more information about SWESTR, please see the Riksbank’s website.

Our Power BI report, called Swedish krona (SEK) exchange rates & bond yields, presents the SEK performance against an array of currencies. It also presents the SEK bond yields as well as the bond yields for select currencies. The data is read from the Swedish central bank – the Riksbank – and it goes back to 2010. We will here review the SEK exchange rate performance.

To start with, the report has a table with quarterly development since 2010. The user can expand to see the performance either per quarter or per month.

SEK exchange rate development since 2010

The total development since 2010 is presented and some highlights are:

  • SEK has strengthened vs JPY by 7%
  • SEK has strengthened vs NOK by 20%
  • SEK has weakened vs CHF by 75%
  • SEK has weakened vs EUR by 10%

We also present a chart and a filter possibility with respect to the date range and currencies of interest. Here, the user wants to review SEK performance vs JPY, NOK, CHF and EUR since 2018.

SEK exchange rate development against CHF, EUR, JPY and NOK

To further help the user understand possible reasons behind the development, the report presents the bond yields for the currencies where such data is available. For example, here the user reviews JPY and SEK bond yields since 2019. Also the so called “bond spreads”, in this case the difference between 10 years yield and 5 years yield, are presented. If, for example 5 years yield is much higher than the 10 years yield, one scenario could be that investors might skip investments in the 10 years as the 5 years offers higher yield with shorter “lock-up” period. In addition, the exchange rate development is overlaid in two of the charts, in order to show the correlation between bond yields and exchange rate for the selected currencies.

The development of SEK and JPY bond yields and exchange rates since 2019

Finally, the report ends with an extensive summary page. The development is evaluated in many different time periods, for example quarter-to-date (QTD), vs 1 year ago, vs 5 years ago and vs 10 years ago. This gives both an emphasis on the more recent values but also gives some history without the need of adding charts.

An extensive summary page with multiple comparisons

More blog posts

On the development of the SEK exchange rates & bond yields in Q3 2025

We analyse the development of the SEK exchange rates & bond yields in Q3 2025. We use a Power BI...

On the development of SWESTR in Q3 2025

We analyse the development of the SWESTR in Q3 2025. We use a Power BI report and also review the...

Reading monetary policy data from the Riksbank via REST API

We analyse the development of the SWESTR in May 2024. We use a Power BI report and also review the...

On the development of SWESTR in May 2024

We analyse the development of the SWESTR in May 2024. We use a Power BI report and also review the...

On the development of the SEK exchange rates & bond yields in May 2024

We analyse the development of the SEK exchange rates & bond yields in May 2024. We use a Power BI...

On the development of the SEK exchange rates & bond yields in April 2024

We analyse the development of the SEK exchange rates & bond yields in April 2024. We use a Power BI...

On the development of the NOK exchange rates & bond yields in March and Q1 2024

We analyse the development of the NOK exchange rates & bond yields in March and Q1 2024. We use a...

On the development of SWESTR in March and Q1 2024

We analyse the development of the SWESTR in March and Q1 2024. We use a Power BI report and also...

On the development of the SEK exchange rates & bond yields in March and Q1 2024

We analyse the development of the SEK exchange rates & bond yields in March and Q1 2024. We use a...

A closer look at the SEK exchange rate development using Power BI Read More »

Get data Power BI

How to read data from a REST API To Power BI – using Swedish central bank data as example

Blog

How to read data from a REST API to Power BI – using Swedish central bank data as example

In this blog post, we are going to go behind the scenes of the development of two reports available in our Portfolio. These reports read data from the Swedish central bank – the Riksbank – directly to Power BI. We do so by utilising the REST APIs provided by the Riksbank. REST API stands for REpresentational State Transfer API, and it is a common way of structuring and accessing data in a programmatic way.

Background on REST APIs

Some REST APIs have security measures in place, so that only authorised users can access the data. The user then has to send credentials by using the API, and if they are verified correctly, data can be read. With the Riksbank’s API it is not required with credentials. Hence, this guide is going to skip that part, and we are only reading, not writing, data when using the API. We are going to access interest rates for the SWESTR which is a reference rate with short duration (overnight rate). For more information about SWESTR, please see the Riksbank’s website.

How to read data from a REST API to Power BI

The user starts by going to Get data in Power BI. It is going to look like this, and then the user selects “Web” in the list.

Get Data Power BI

From the Riksbank’s website, we see that the request to get all the interest rate values is:

https://api.riksbank.se/swestr/v1/all/{interestRateId}?fromDate={fromDate}[&toDate]

We also read that interestRateId = SWESTR shall be used and we set fromDate = 2023-01-01. The toDate is optional, as indicated by [], and we skip it. It will then read all the data up until today. The request will look like:

https://api.riksbank.se/swestr/v1/all/SWESTR?fromDate=2023-01-01

We simply add that to the URL requested in Power BI.

Read data from REST API to Power BI

The user gets the data from 1st January 2023 in return. Each row of the data is the data for that day, for example the interest rate and the volume during that day.

Data has been read from the Riksbank's REST API to Power BI

The data connection is now established, and it is now easy to refresh by a single click in Power BI.

For more information about the APIs provided by the Riksbank, please see their documentation.

More blog posts

On the development of the SEK exchange rates & bond yields in Q3 2025

We analyse the development of the SEK exchange rates & bond yields in Q3 2025. We use a Power BI...

On the development of SWESTR in Q3 2025

We analyse the development of the SWESTR in Q3 2025. We use a Power BI report and also review the...

Reading monetary policy data from the Riksbank via REST API

We analyse the development of the SWESTR in May 2024. We use a Power BI report and also review the...

On the development of SWESTR in May 2024

We analyse the development of the SWESTR in May 2024. We use a Power BI report and also review the...

On the development of the SEK exchange rates & bond yields in May 2024

We analyse the development of the SEK exchange rates & bond yields in May 2024. We use a Power BI...

On the development of the SEK exchange rates & bond yields in April 2024

We analyse the development of the SEK exchange rates & bond yields in April 2024. We use a Power BI...

On the development of the NOK exchange rates & bond yields in March and Q1 2024

We analyse the development of the NOK exchange rates & bond yields in March and Q1 2024. We use a...

On the development of SWESTR in March and Q1 2024

We analyse the development of the SWESTR in March and Q1 2024. We use a Power BI report and also...

On the development of the SEK exchange rates & bond yields in March and Q1 2024

We analyse the development of the SEK exchange rates & bond yields in March and Q1 2024. We use a...

How to read data from a REST API To Power BI – using Swedish central bank data as example Read More »

Considerations of SMEs’ reporting & analytics capabilities

Blog

Considerations of SME’s reporting & analytics capabilities

For small-to-medium enterprises (SMEs), choosing how to report and analyse business performance can be tricky. The needs can also vary largely depending on industry and company size. For example, the medium-sized tech company with 15 employees with ambitions to upscale their business and attract external capital, might need sophisticated reporting solutions. The company will benefit in the external communication, and if also the right analytics capabilities are built (and used!), the chances of upscaling the business will be higher. On the other hand, the small hotel with 10 rooms, might not need the same sophistication, and it might even be so that the business can be well understood without advanced analytics tools. We would argue, however, that both businesses will benefit by automating some, if not most of their reporting and streamlining their performance monitoring.

For example, the hotel might have good overview of bookings by their booking tool. They might handle their financials in another accounting software or with Microsoft Excel. As a third component, they might get user satisfaction data from Google or by other means, like Tripadvisor. To truly integrate all the data streams needed might be a bit too much here. However, they should be able to automatically extract their booking statistics and combine it with their financials, and come up with, say, 10 KPIs to track. How does their historical booking numbers in Q4 (October – December) correlate with their financial performance in the same time period, and how does it compare to the other quarters? What is the sensitivity in the booking rate on the financials, meaning how has +/- 10% in booking rate historically impacted the financials? Perhaps +10% is usually a nice bonus, but -10% is a disaster. That could then impact the whole business steering and the -10% is to be avoided at all costs.

As a general advice for businesses relating to the hotel scenario, they can gain time and business insight by automating some of their KPIs. There will be an upfront investment to build a sophisticated data solution with data extraction, calculations, merges, presentation etc., but also running costs such as license costs for data extraction and cloud costs. Smaller businesses might also be more vulnerable to security issues, so that is also an important consideration. An advice would be to limit the data that you want to analyse and also to anonymise the data. Even if the developer considers security aspects in the development, a data issue might occur by a 3rd party such as the selected cloud provider. If you do not have an IT person at hand in your business, the lead times will be longer and the exposure larger.

The advices are therefore to:

  • Decide on, and limit, the ambition – for example to develop a report with 10 KPIs covering the business
  • Decide on the security requirements
  • Decide on the budget – both for upfront costs and for maintenance

In the case with the scale-up tech company, there will likely be better IT resources available. The ambition will also need to be higher – for two reasons. The accuracy of the business performance and also the depth at which the business can be analysed, will have to be higher to attract external capital. The data can also be used to guide the company in the growing phase, for example, they can benefit from understanding their position vs the competitors. That is not to say the company needs to have a data-driven steering. Some companies might prefer a “feelings” approach to steering, but arguably they can benefit from having analytics capabilities in some way or form. In general, the same advices apply here – ambition, security requirements and budget.

More blog posts

On the development of the SEK exchange rates & bond yields in Q3 2025

We analyse the development of the SEK exchange rates & bond yields in Q3 2025. We use a Power BI...

On the development of SWESTR in Q3 2025

We analyse the development of the SWESTR in Q3 2025. We use a Power BI report and also review the...

Reading monetary policy data from the Riksbank via REST API

We analyse the development of the SWESTR in May 2024. We use a Power BI report and also review the...

On the development of SWESTR in May 2024

We analyse the development of the SWESTR in May 2024. We use a Power BI report and also review the...

On the development of the SEK exchange rates & bond yields in May 2024

We analyse the development of the SEK exchange rates & bond yields in May 2024. We use a Power BI...

On the development of the SEK exchange rates & bond yields in April 2024

We analyse the development of the SEK exchange rates & bond yields in April 2024. We use a Power BI...

On the development of the NOK exchange rates & bond yields in March and Q1 2024

We analyse the development of the NOK exchange rates & bond yields in March and Q1 2024. We use a...

On the development of SWESTR in March and Q1 2024

We analyse the development of the SWESTR in March and Q1 2024. We use a Power BI report and also...

On the development of the SEK exchange rates & bond yields in March and Q1 2024

We analyse the development of the SEK exchange rates & bond yields in March and Q1 2024. We use a...

Considerations of SMEs’ reporting & analytics capabilities Read More »