Reporting & Analytics

NOK exchange rates and bond yields

On the development of the NOK exchange rates & bond yields in February 2024

Blog

On the development of the NOK exchange rates & bond yields in February 2024

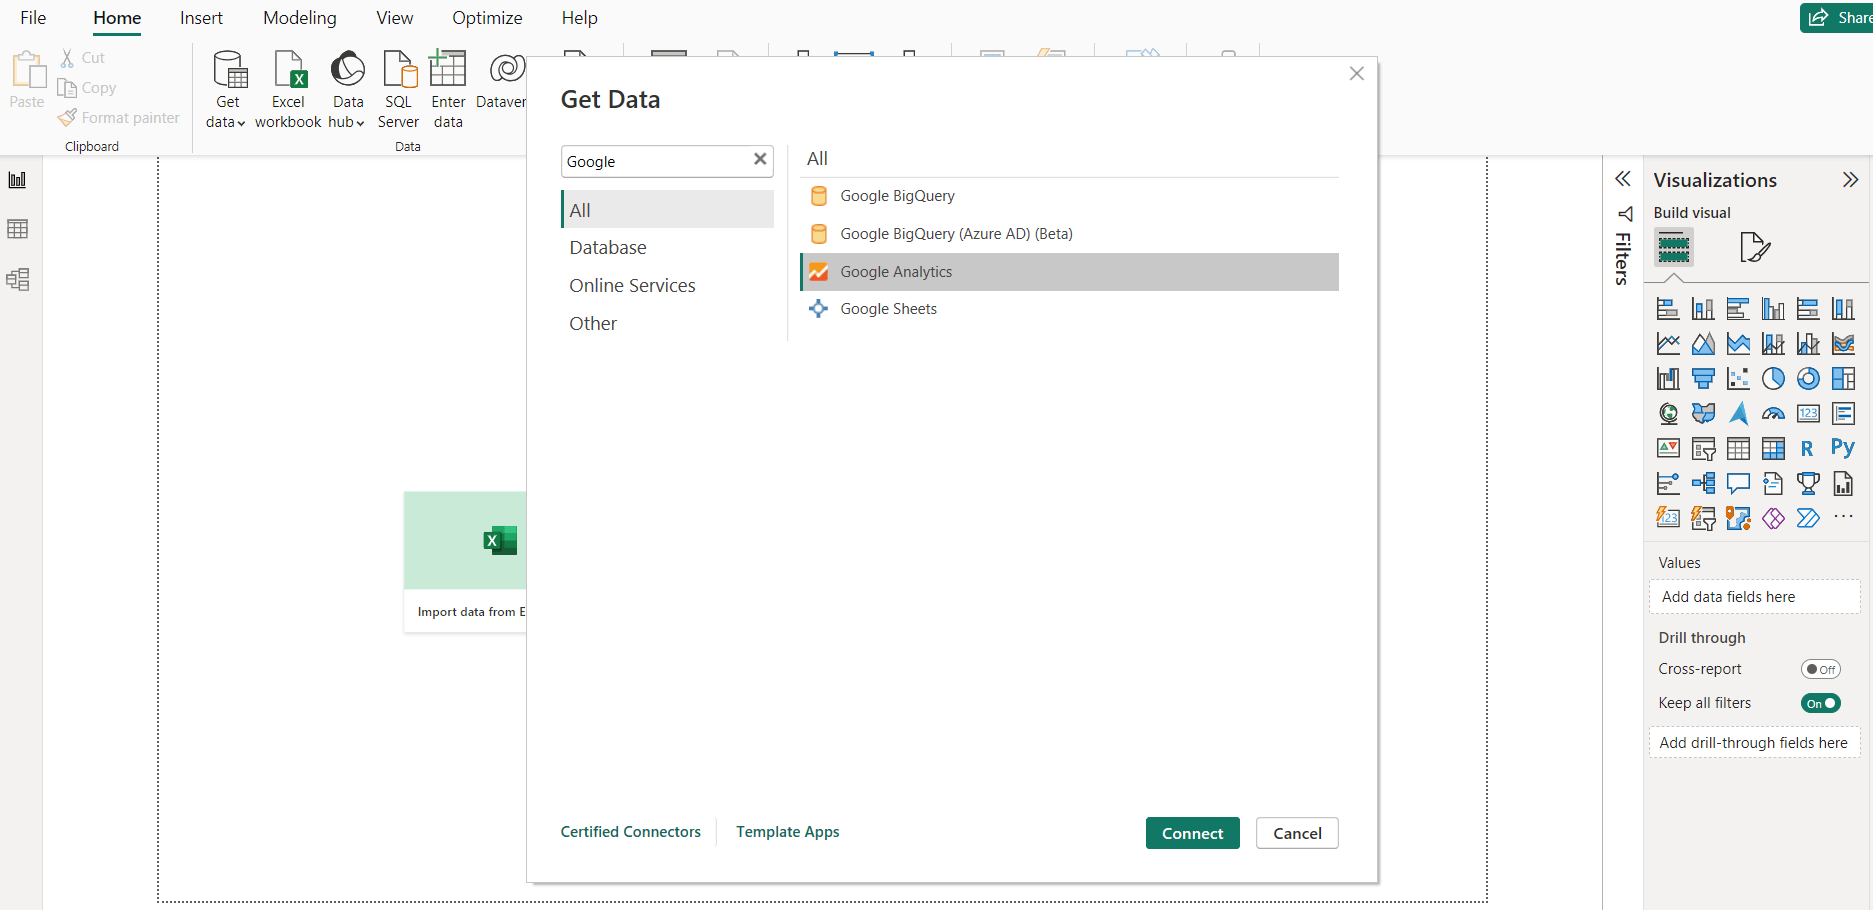
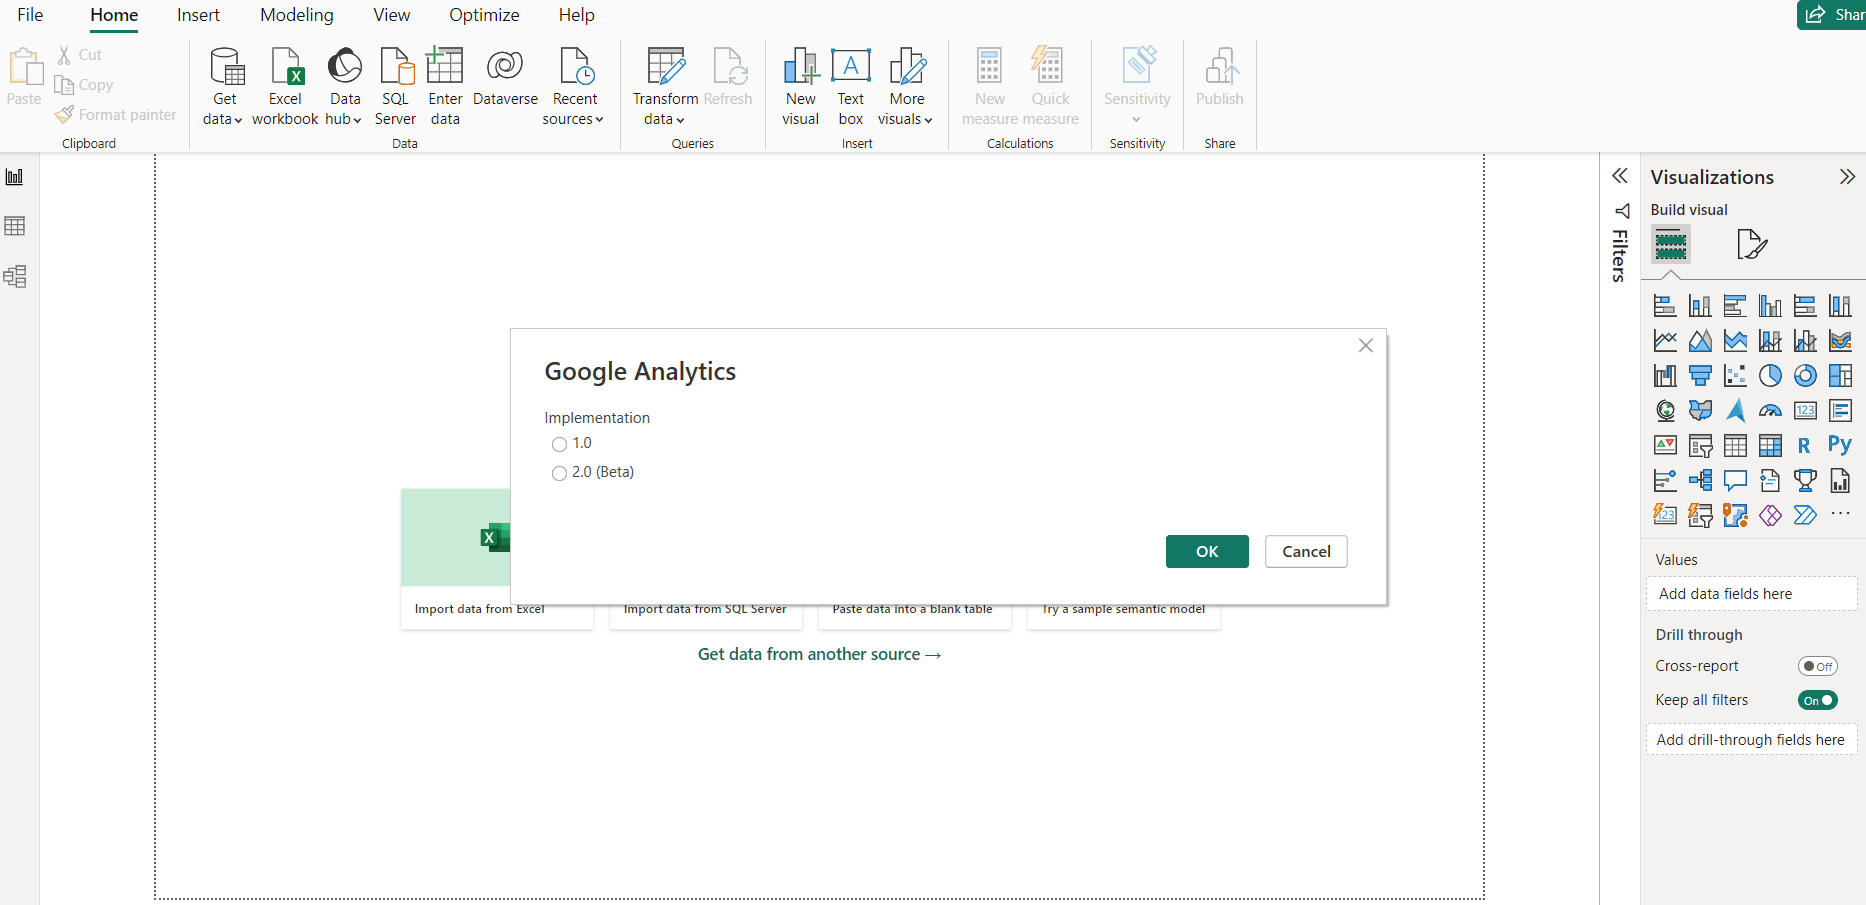
We analyse the development of the Norwegian krone (NOK) exchange rates and bond yields in February 2024. We do so by using a Power BI report that is available in our Portfolio. The source of all data is the Norwegian central bank – Norges Bank.

February 2024 overview

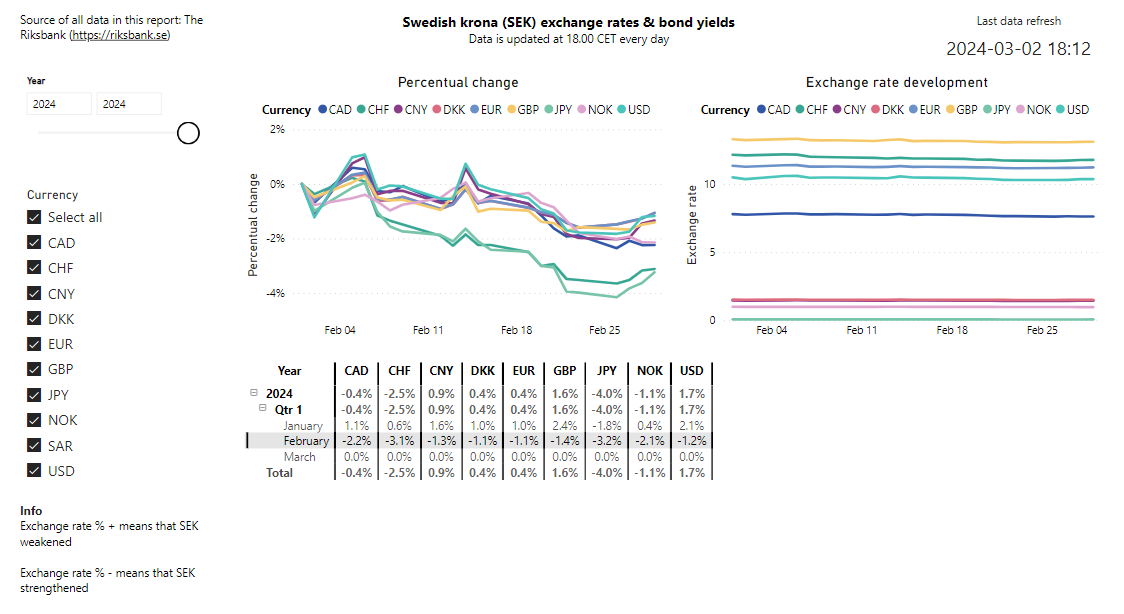
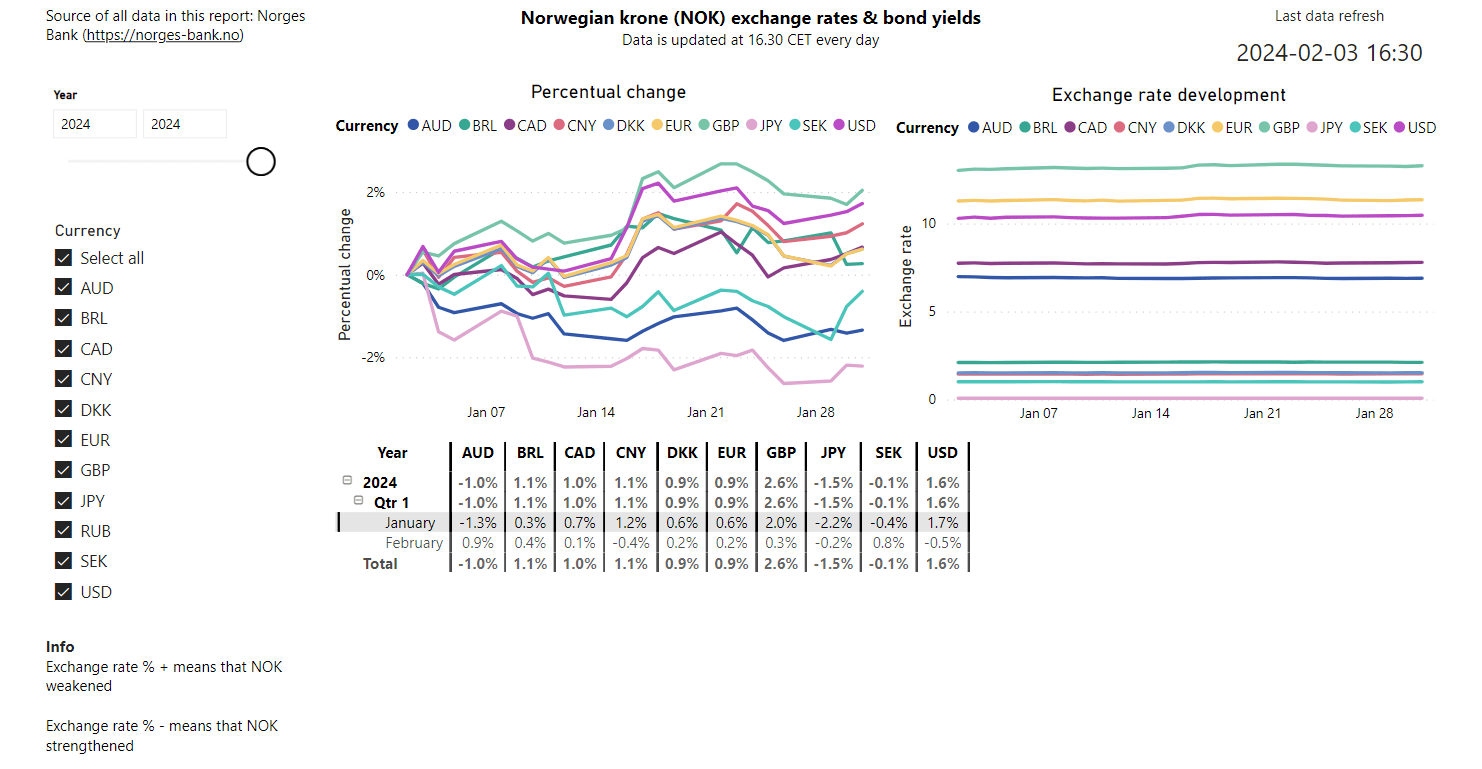
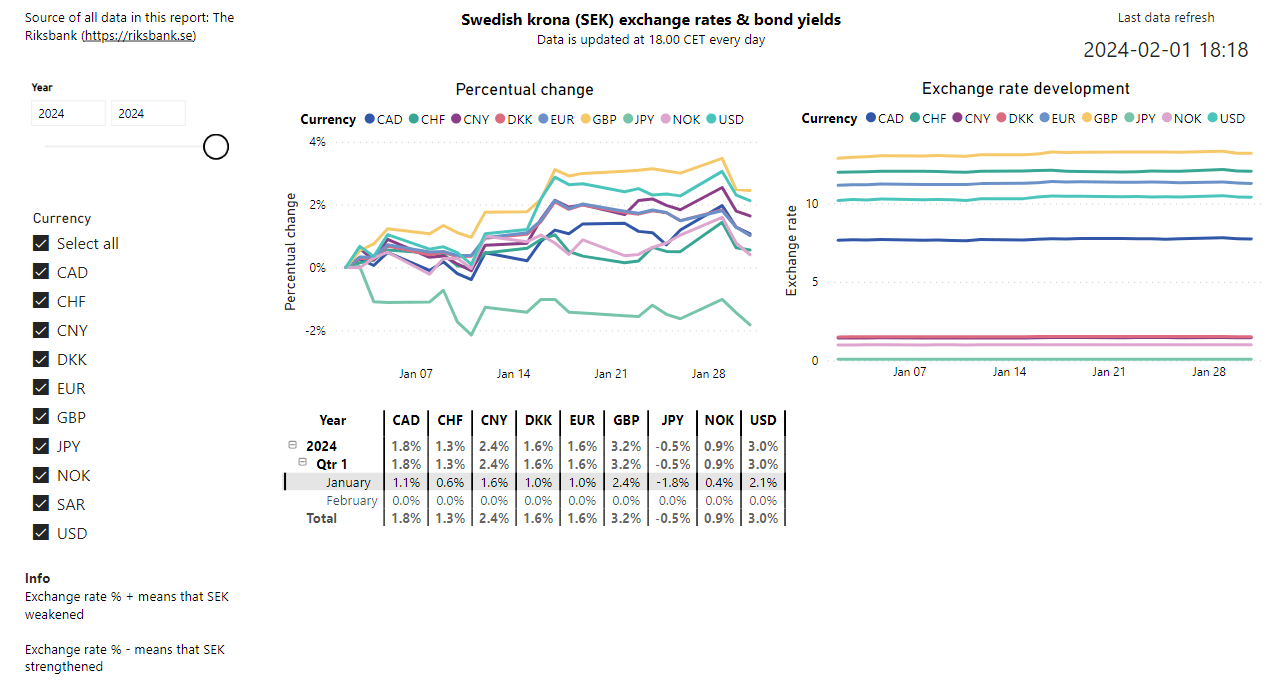
We start by going to this page and expanding the table so that the development in each month is visible. Then we click on February and consequently the whole page will be updated with February as a filter. This is a convenient way to filter without having explicit filters visually present in the report, which shows how dynamic Power BI is.

The development of the NOK exchange rates in February 2024

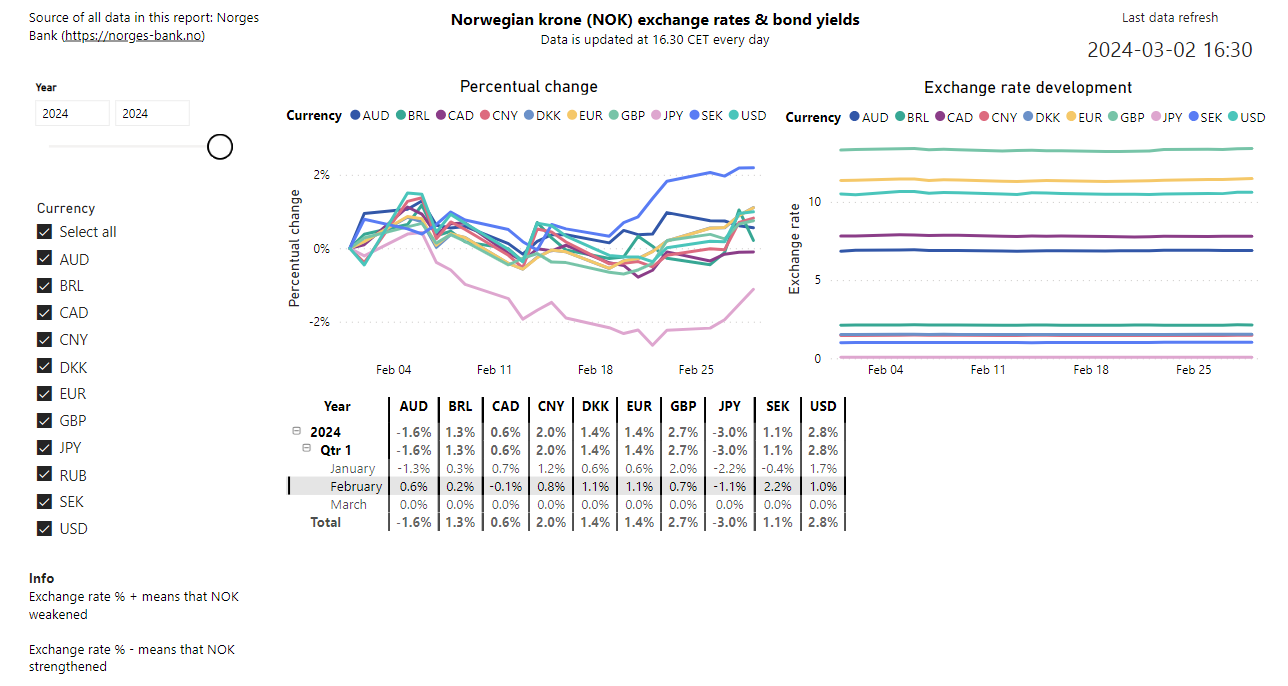
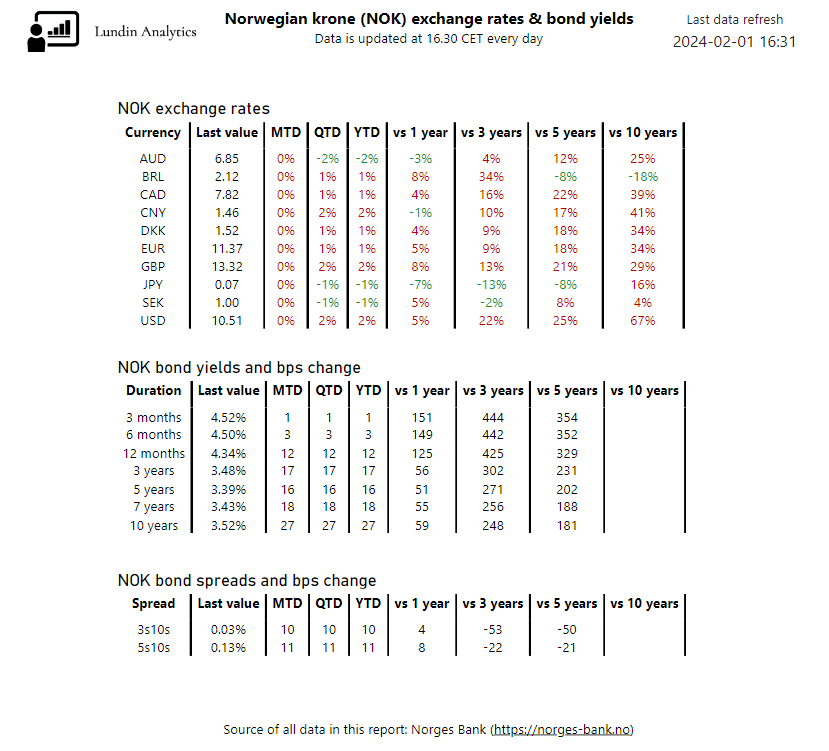
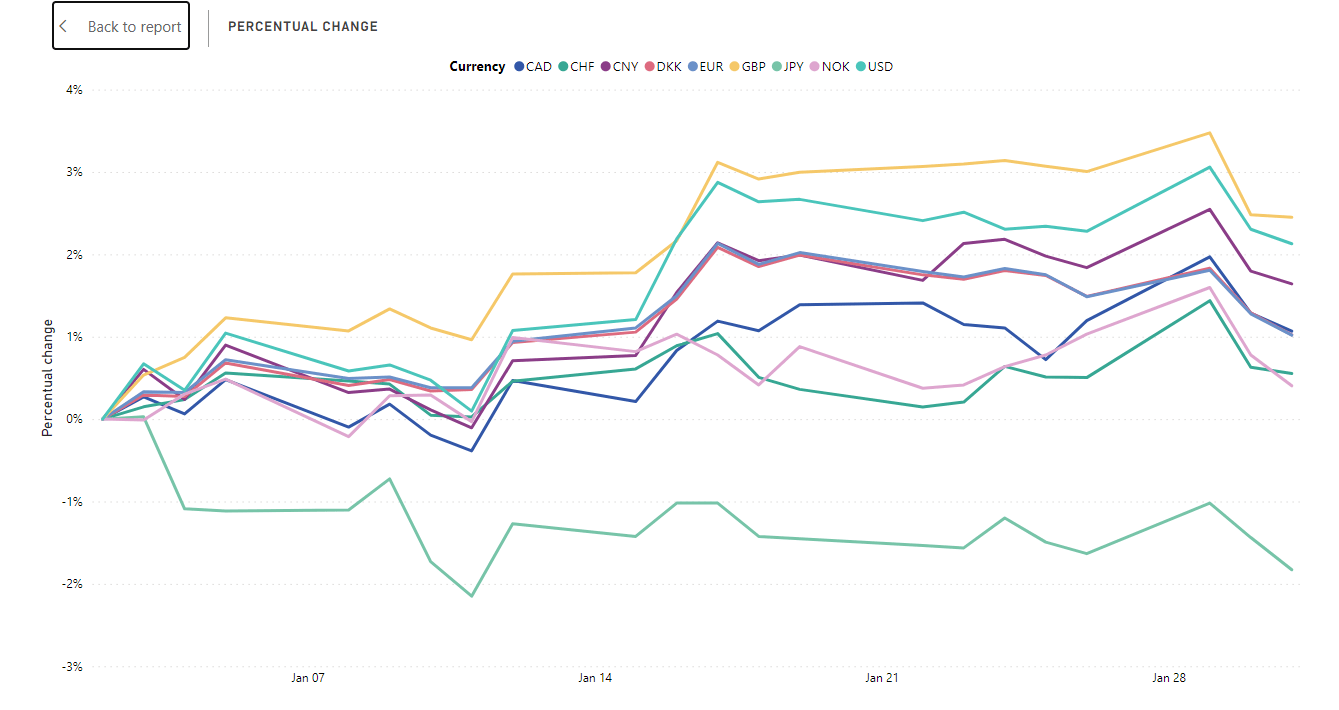
We then see that, in February, NOK strengthened against two currencies – Canadian dollar (CAD) and Japanese yen (JPY). Similarly to what we reported in our blog post on the January development, there were no dramatic changes of the NOK exchange rates in February. In February, all movements were in the range from -1% to 2%. It can be noted here that + means that NOK weakened, and – means that NOK strengthened. For example, if the EUR-NOK exchange rate goes from 10 to 11, that +1 change is a weakening of the NOK.

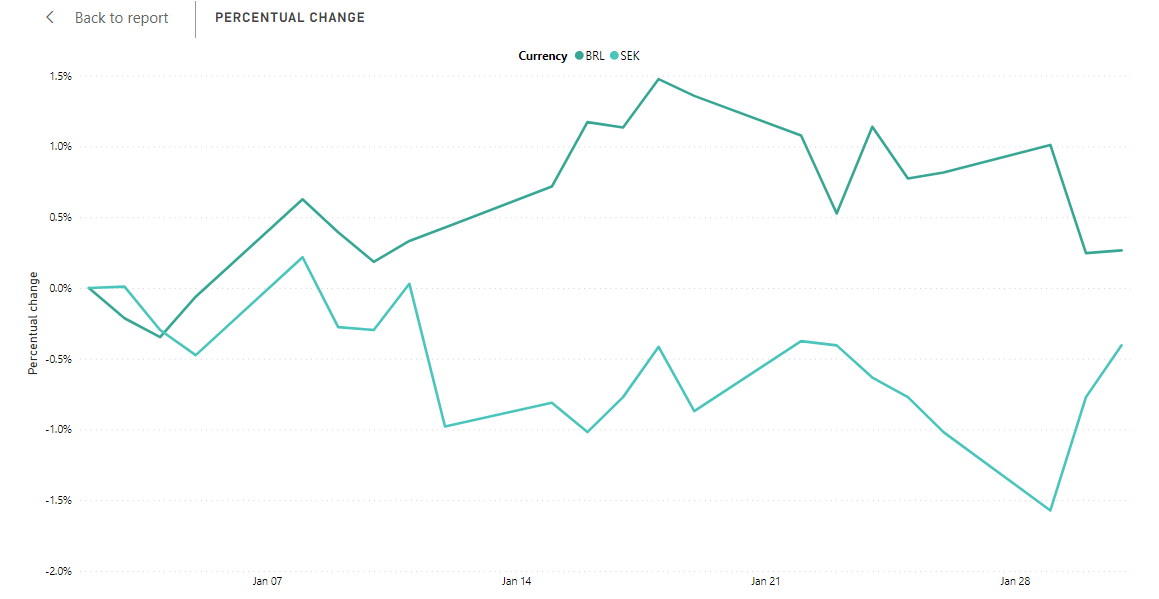
We note that NOK weakened the most – by 2.2% – against Swedish krona (SEK). We noted in our blog post on the SEK’s February development that SEK strengthened against many large currencies like CHF, EUR, GBP and USD. However, NOK weakened in February by 0.7% against GBP and by 1.0% against USD.

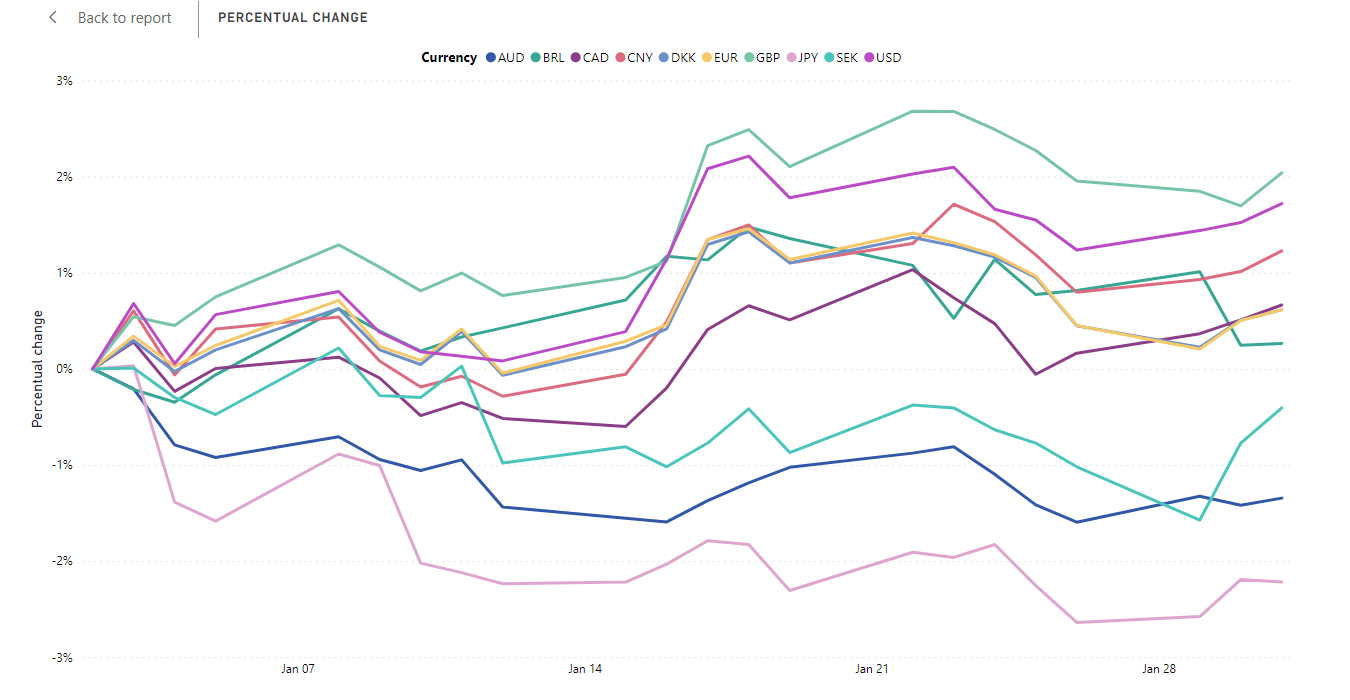
Year-to-date (YTD) in 2024, NOK has strengthened against Australian dollar (AUD) by 1.6% and against JPY by 3.0%. All movements YTD are in the range from -3% to 3%.

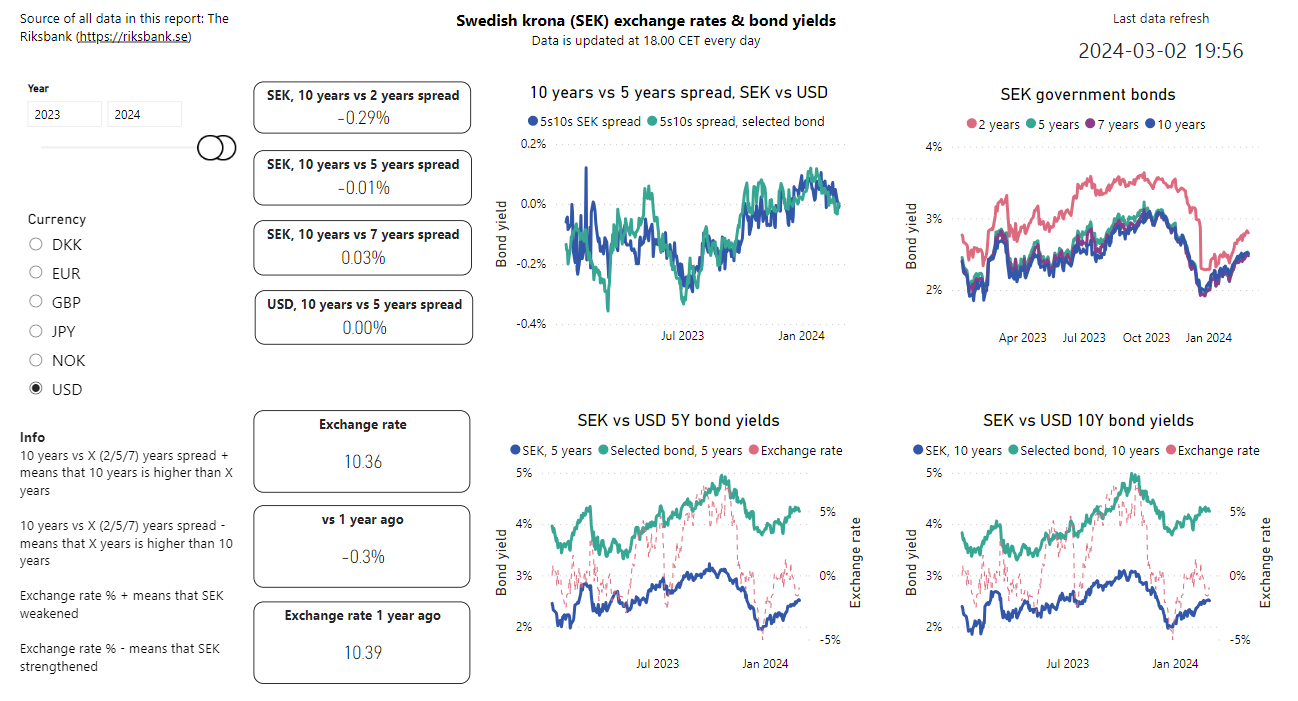
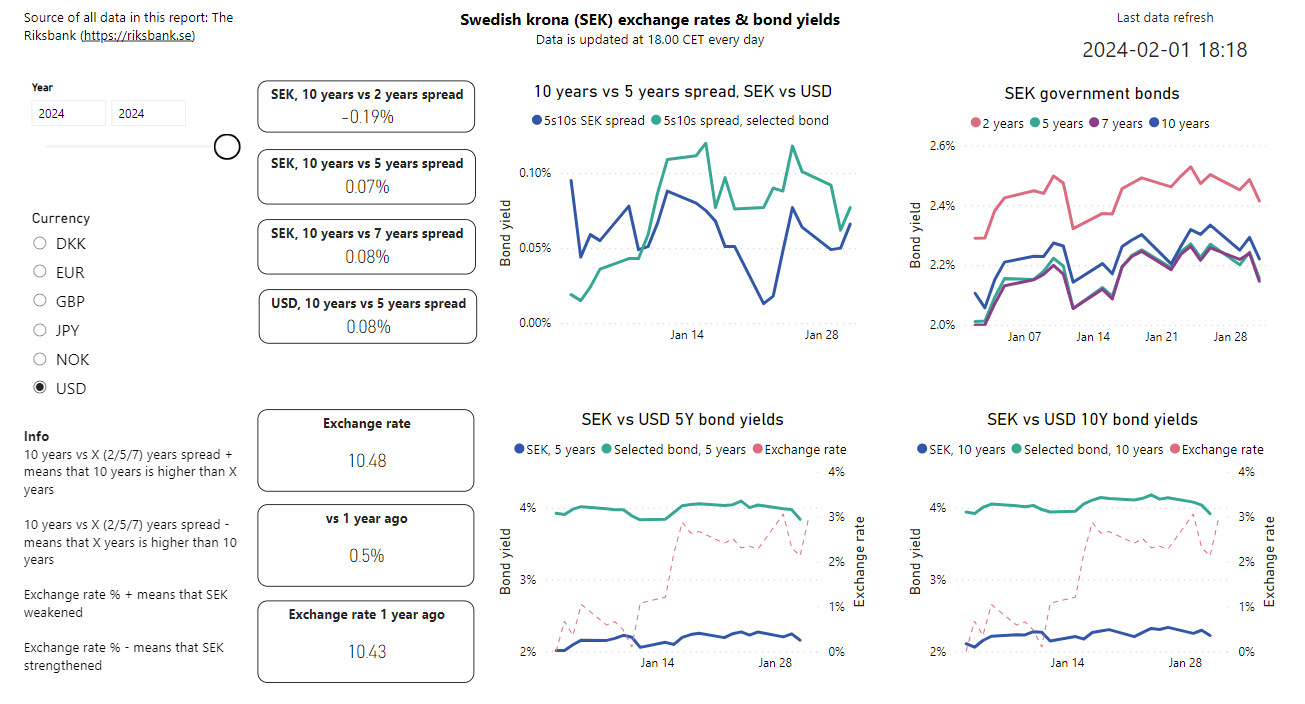
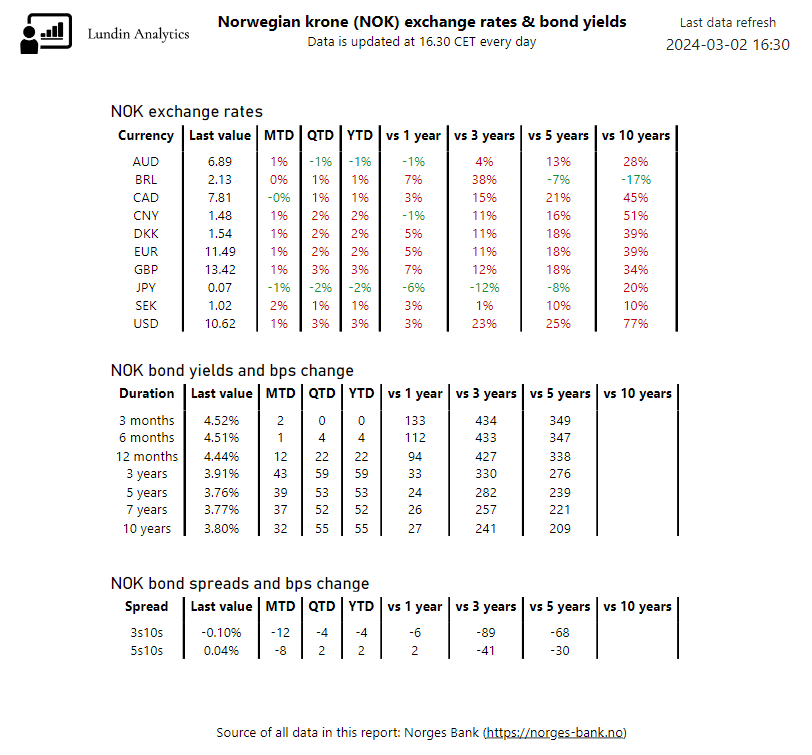
We then look at a summary page of the exchange rates in conjunction with NOK bond yields. First, we filter the page so that it only considers data before 1st of March 2024. We then see that there were large increases in the bond yields in February. For example, the 3 years bond yield increased by 43 bps to 3.91% and the 10 years yield increased by 32 bps to 3.80%. On the other hand, the bonds with short duration increased by smaller amounts. For example, the 6 months yield only increased by 4 bps to 4.51%, which is close to Norway’s current policy rate at 4.50%.

NOK exchange rates and bond yields
Summary view of the NOK exchange rates and bond yields with data from Norges Bank

Year-to-date, the bond yields have increased significantly, and some examples are:

  • 3 years: +59 bps to 3.91%
  • 5 years: +53 bps to 3.76%
  • 10 years: +55 bps to 3.80%

Finally, we review the bond spreads, which are the differences in yields between shorter-term bonds and longer-term bonds. For example, a common financial metric is to measure the difference in yield between a 5 years bond and a 10 years bond. We see that the 3s10s bond spread decreased by 12 bps to -0.10%, since the 3 years yield increased by 43 bps but the 10 years yield only increased by 32 bps.

Summary

In February 2024, there were no dramatic changes of the NOK exchange rates against major currencies like GBP, EUR, JPY and USD. The NOK weakened by 2.2% against SEK and by 1.1% against EUR. Meanwhile, the NOK strengthened by 1.1% against JPY.

With regards to the bond yields, there were large increases in the NOK bond yields in February. The bonds with short duration (3 – 12 months) barely moved but the ones with longer duration increased more, for example the 10 years yield increased by 32 bps in February.

More blog posts

On the development of the SEK exchange rates & bond yields in Q3 2025

We analyse the development of the SEK exchange rates & bond yields in Q3 2025. We use a Power BI...

On the development of SWESTR in Q3 2025

We analyse the development of the SWESTR in Q3 2025. We use a Power BI report and also review the...

Reading monetary policy data from the Riksbank via REST API

We analyse the development of the SWESTR in May 2024. We use a Power BI report and also review the...

On the development of SWESTR in May 2024

We analyse the development of the SWESTR in May 2024. We use a Power BI report and also review the...

On the development of the SEK exchange rates & bond yields in May 2024

We analyse the development of the SEK exchange rates & bond yields in May 2024. We use a Power BI...

On the development of the SEK exchange rates & bond yields in April 2024

We analyse the development of the SEK exchange rates & bond yields in April 2024. We use a Power BI...

On the development of the NOK exchange rates & bond yields in March and Q1 2024

We analyse the development of the NOK exchange rates & bond yields in March and Q1 2024. We use a...

On the development of SWESTR in March and Q1 2024

We analyse the development of the SWESTR in March and Q1 2024. We use a Power BI report and also...

On the development of the SEK exchange rates & bond yields in March and Q1 2024

We analyse the development of the SEK exchange rates & bond yields in March and Q1 2024. We use a...

On the development of the NOK exchange rates & bond yields in February 2024 Read More »

On the development of the SEK exchange rates & bond yields in February 2024

Blog

On the development of the SEK exchange rates & bond yields in February 2024

We analyse the development of the SEK exchange rates and bond yields in February 2024. We do so by using a Power BI report that is available in our Portfolio.

February 2024 overview

We start by going to this page and changing the Date filter in the filter menu. This is only accessible to us as the report creators. We do the filtering because otherwise the report will think that we are in March, hence the month-to-date (MTD) values will be incorrect as an example. This page is a summary view of the SEK exchange rates & bond yields, and comparisons against large currencies like GBP, EUR and USD can be seen.

The development of the SEK exhange rates and bond yields in February 2024

The filtering in Power BI looks like below.

Filter menu in Power BI

We then see that in February, the SEK strengthened against all the currencies in the report. It strengthened the most – by 3% – against Swiss franc (CHF) and Japanese yen (JPY). In our blog post about the January 2024 SEK development, we noticed that SEK only strengthened against one currency – the JPY.

In general, there were no dramatic changes in February, just like in January. The SEK movements were in the range from -1% to -3%. It can be noted here that + means that SEK weakened, and – means that SEK strengthened. For example, if the EUR-SEK exchange rate goes from 10 to 11, that +1 change is a weakening of the SEK.

When looking at the quarter-to-date (QTD) and year-to-date (YTD) values, which are the same in the first quarter, we see that the SEK movements are within the range -4% (strengthening) to +2% (weakening), and again it has strengthened the most against JPY and CHF. It has weakened the most against GBP and USD – by 2%.

We also note that there were large changes to the bond yields in February, not only to the SEK bond yields. We see that the GBP 5 years and USD 5 years bond yields increased by 34 respective 43 bps. The SEK 5 years yield increased by approximately the same value – by 39 bps.

For SEK, we read several different bond yields, and we notice something interesting for the 2 years and 10 years yields development in February. The SEK 2 years yield increased by 42 bps, but the 10 years yield only increased by 28 bps. That is a 14 bps difference. Hence, the so called “bond spread” between the 2 years and 10 years yields, decreased by 14 bps in February.

To get further insight on the bond yields, we go to this page and change the Year filter to range from 2023 to 2024. We see that there is a clear increase in all the SEK bond yields in February 2024.

SEK exchange rates and bond yields
SEK exchange rates and bond yields in comparison to USD bond yields

Finally, we go to this page and click on February in the table. By doing so, the Power BI page will be updated with February as a filter. We then see the more exact numbers of the SEK strengthening in February.

The development of the SEK exchange rates in February 2024

For example, some highlighted changes are the following SEK movements:

  • Strengthening against JPY by 3.2%
  • Strengthening against CHF by 3.1%
  • Strengthening against CAD by 2.2%
  • Strengthening against NOK by 2.1%

Summary

In February 2024, there were no dramatic changes of the SEK exchange rates compared to major currencies like GBP, EUR and USD. The SEK strengthened against many of the large currencies, for example it strengthened by 3.2% against JPY and 3.1% vs CHF.

With regards to bond yields, there were larger changes both for the SEK yields and other bond yields like USD and GBP. For example, the SEK 5 years yield increased by 39 bps, which can be compared to +43 bps for USD and +34 bps for GBP.

More blog posts

On the development of the SEK exchange rates & bond yields in Q3 2025

We analyse the development of the SEK exchange rates & bond yields in Q3 2025. We use a Power BI...

On the development of SWESTR in Q3 2025

We analyse the development of the SWESTR in Q3 2025. We use a Power BI report and also review the...

Reading monetary policy data from the Riksbank via REST API

We analyse the development of the SWESTR in May 2024. We use a Power BI report and also review the...

On the development of SWESTR in May 2024

We analyse the development of the SWESTR in May 2024. We use a Power BI report and also review the...

On the development of the SEK exchange rates & bond yields in May 2024

We analyse the development of the SEK exchange rates & bond yields in May 2024. We use a Power BI...

On the development of the SEK exchange rates & bond yields in April 2024

We analyse the development of the SEK exchange rates & bond yields in April 2024. We use a Power BI...

On the development of the NOK exchange rates & bond yields in March and Q1 2024

We analyse the development of the NOK exchange rates & bond yields in March and Q1 2024. We use a...

On the development of SWESTR in March and Q1 2024

We analyse the development of the SWESTR in March and Q1 2024. We use a Power BI report and also...

On the development of the SEK exchange rates & bond yields in March and Q1 2024

We analyse the development of the SEK exchange rates & bond yields in March and Q1 2024. We use a...

On the development of the SEK exchange rates & bond yields in February 2024 Read More »

How to create a hierarchy in Power BI

Blog

How to create a hierarchy in Power BI

In this blog post, we will learn how to create a hierachy in Power BI. This can be useful for example when analysing sales within different categories. The sales can then be measured and analysed for all the categories in an efficient way.

Another example, which we will go through, is how to create a date hierarchy in Power BI. This is convenient for the user because it is then easy to analyse performance per Year, Quarter, Month and Day and easily switch between these perspectives.

How to create the hierarchy

Just like in a previous post, where we discussed the streaming of GA4 data to Power BI, we can continue the example of the e-commerce business. The e-commerce business measures sales at various levels. The levels and their possible values are:

  • Level 1 – Clothing, Watches, Accessories
  • Level 2 – Men, Women
  • Level 3 – Summer, Winter

Even this relatively simple example leads to several combinations that need to be analysed. A hierarchy will solve this efficiently for us, and we do not have to create specific calculations in order to measure for example “Clothing, Women, Summer” performance.

To start with, we go to the Home tab in Power BI, and then we right-click on the Level 1 column where we select “Create hierarchy”.

Hierarchy in Power BI
Right-click in Power BI and select Create hierarchy

We then rename the hierarchy to “Product hierarchy”, right-click on Level 2 and add it to Product hierarchy. We also do the same for the Level 3 column.

Power BI hierarchy
Right-click on the column name and select Add to hierarchy

By using a matrix visualisation, we then verify our hierarchy. We add the hierarchy and also the Sales column to the matrix visualisation. By expanding the matrix, we can see in the pictures below what the sales look like for each level.

Visualisation of sales data – Level 1 of our hierarchy
Power BI hierarchy
Visualisation of sales data – Level 2 of our hierarchy
Power BI hierarchy
Visualisation of sales data – Level 3 of our hierarchy

How to create a date hierarchy

A common use case of hierarchies is to create one that helps you break down your KPIs in different time periods, a so called date hierarchy. Typically, we will have a Calendar table in our Power BI model. We can then create our date hierarchy by the following steps.

First, we decide that we want to replicate this structure in Power BI:

  • Year
    • Quarter
      • Month
        • Day

To start with, we notice that all these four columns exist in our Calendar table. We then right-click on Year, as that is our highest level, and select “Create hierarchy”.

Date hierarchy in Power BI
Right-click on Year and select Create hierarchy

We also right-click on the hierarchy and name it “Date hierarchy”. Finally, we add the Quarter, Month and Day columns to our newly created Date hierarchy. We do so by using the same method that we used above, that is, to right-click and select Add to hierarchy.

Again, we verify our hierarchy by using a matrix visualisation. We see that we now have a convenient way of switching between Year, Quarter, Month and Day. We also notice that the sorting of the Months is in alphabetic order, which is not optimal. There are ways around that, but that is for another blog post – stay tuned.

Date hierarchy in Power BI

Summary

We learnt how to create a hierarchy in Power BI and discussed two examples where this can be useful. A common scenario is to create a Date hierarchy, but it is also useful for other scenarios like the example we discussed, where an e-commerce business wants to analyse their sales by different categories.

More blog posts

On the development of the SEK exchange rates & bond yields in Q3 2025

We analyse the development of the SEK exchange rates & bond yields in Q3 2025. We use a Power BI...

On the development of SWESTR in Q3 2025

We analyse the development of the SWESTR in Q3 2025. We use a Power BI report and also review the...

Reading monetary policy data from the Riksbank via REST API

We analyse the development of the SWESTR in May 2024. We use a Power BI report and also review the...

On the development of SWESTR in May 2024

We analyse the development of the SWESTR in May 2024. We use a Power BI report and also review the...

On the development of the SEK exchange rates & bond yields in May 2024

We analyse the development of the SEK exchange rates & bond yields in May 2024. We use a Power BI...

On the development of the SEK exchange rates & bond yields in April 2024

We analyse the development of the SEK exchange rates & bond yields in April 2024. We use a Power BI...

On the development of the NOK exchange rates & bond yields in March and Q1 2024

We analyse the development of the NOK exchange rates & bond yields in March and Q1 2024. We use a...

On the development of SWESTR in March and Q1 2024

We analyse the development of the SWESTR in March and Q1 2024. We use a Power BI report and also...

On the development of the SEK exchange rates & bond yields in March and Q1 2024

We analyse the development of the SEK exchange rates & bond yields in March and Q1 2024. We use a...

How to create a hierarchy in Power BI Read More »

Exploring data streaming from GA4 to Power BI

Blog

Exploring data streaming from GA4 to Power BI

In this blog post, we will explore in more detail what kind of data can be read from Google Analytics 4 (GA4) to Power BI. In a previous blog post, we explored how to technically set up the data streaming from GA4 to Power BI.

We also discussed in our previous post that reading Sessions, Bounce rate, Hits, Session duration per page, Visitor source and Visitor type is a good idea. We argue that reading these KPIs is relevant for all businesses.

Google Search Console data to Power BI

It is possible to link Google Search Console (GSC) to GA4. By doing that, we are also able to in turn read the GSC data to Power BI by using the GA4 connection. The benefit of doing this, is that we can not only see the on-site KPIs, but we can also connect it to how our site is performing in Google searches. In addition, thanks to Power BI, we can tailor our reporting to our preferences instead of relying on the report provided by Google in the Search Console. However, the full scope of the GSC data is not available in Power BI, so it is more to be seen as a complement to the regular GSC report.

From GSC, we can read these KPIs which are related to search performance:

  • Organic Google Search average position
  • Organic Google Search clicks
  • Organic Google Search click through rate
  • Organic Google Search impressions
Google Search Console data to Power BI
Streaming Google Search Console data to Power BI

Indeed it is a bit limited how many KPIs we can read, but actually the four KPIs above cover the search performance quite well if they are measured in the right ways. That brings us to the next step, where we select in which dimensions we want to measure these KPIs. Here, we have selected countrydevice category and date. The data will then look like this in Power BI.

Google search data in Power BI

E-commerce data in GA4

As an example of what data is available in GA4, we can review some data points that are relevant for e-commerce businesses. Some examples of relevant KPIs for an e-commerce business, together with their definitions, would be:

  • Active users – Total number of users on the site
  • Checkouts – Number of times that customers started the checkout process
  • Cart to view rate – Number of times that a product is added to a cart vs how many times the product is viewed
  • Ecommerce purchases – Number of completed purchases
  • Gross purchase revenue – Sum of all revenue from purchases
  • Purchases conversion rate – % of users who made a purchase

For an e-commerce business, the above KPIs should be measured in the regular dimensions such as:

  • City
  • Country
  • Date
  • Device cateogry

However, for an e-commerce site it is also important to measure the product dimensions to know the sales of each product. These are called Item category and have five levels, called Item category – Item category 5. In addition, you can read Item ID which is a unique ID for each product that you are selling. Here is an example of what the Item categories can represent:

  • Item category – Clothing
    • Item category 2 – Women
      • Item category 3 – Summer
        • Item category 4 – Shirts
          • Item category 5 – T-shirts

When selecting the dimensions in Power BI, it will look like below.

E-commerce data from GA4 to Power BI

When measuring for example Active users and Sessions, it is quite insightful to break it down by the hierarchy above. Typically you will have multiple values for each category, so you can then compare your Summer clothing performance to Winter clothing performance, for example.

In our case, we do not sell anything directly at our website, hence we have no checkout. So depending on your business, it wil determine what parts of the GA4 data are relevant for you.

We also quickly realise that it is very important to set up all this analytics properly at your site. For example, you need to have proper definitions of Checkouts, Carts, Purchases etc. mapped so that GA4 knows what triggers these events. A competent web agency can help on that topic.

Summary

We discussed what data points can be read from GA4 to Power BI. More specifically, we showed how to read Google Search Console data to Power BI by using the GA4 connector. This way, it is possible to read some limited search traffic data to Power BI, which can be a complement to your normal Google Search reports.

We also discussed examples of data points that are relevant for-e-commerce businesses and showed how they can be read to Power BI from GA4.

More blog posts

On the development of the SEK exchange rates & bond yields in Q3 2025

We analyse the development of the SEK exchange rates & bond yields in Q3 2025. We use a Power BI...

On the development of SWESTR in Q3 2025

We analyse the development of the SWESTR in Q3 2025. We use a Power BI report and also review the...

Reading monetary policy data from the Riksbank via REST API

We analyse the development of the SWESTR in May 2024. We use a Power BI report and also review the...

On the development of SWESTR in May 2024

We analyse the development of the SWESTR in May 2024. We use a Power BI report and also review the...

On the development of the SEK exchange rates & bond yields in May 2024

We analyse the development of the SEK exchange rates & bond yields in May 2024. We use a Power BI...

On the development of the SEK exchange rates & bond yields in April 2024

We analyse the development of the SEK exchange rates & bond yields in April 2024. We use a Power BI...

On the development of the NOK exchange rates & bond yields in March and Q1 2024

We analyse the development of the NOK exchange rates & bond yields in March and Q1 2024. We use a...

On the development of SWESTR in March and Q1 2024

We analyse the development of the SWESTR in March and Q1 2024. We use a Power BI report and also...

On the development of the SEK exchange rates & bond yields in March and Q1 2024

We analyse the development of the SEK exchange rates & bond yields in March and Q1 2024. We use a...

Exploring data streaming from GA4 to Power BI Read More »

How to share Power BI reports

Blog

How to share Power BI reports

In this blog post, we will learn how to share Power BI reports with others. After all, it is important to share the insights from your reports with others. It is an admittedly tricky topic with several rules and exceptions, which we will navigate through.

The Power BI license essentials

To begin with, in Power BI, there are a few different licenses available to the users. The licenses are:

  • Free
  • Pro
  • Premium Per User

To begin with, the free version can be used to build the actual report, but there is no possibility to share a live version of it. However, you can still take snippets or export it to PDF for further distribution. Also, you can share the actual Power BI file, called PBIX, with other users. These users can then install Power BI Desktop and open the PBIX file. This can be achieved all for free, but these are not “live” sharing methods, however.

A more convenient option, is for the report creator to pay for the Pro license. By doing this, the report can be shared with everyone, fully open at Internet. This way, it can also be embedded to websites, just like we have done in our Portfolio. In Power BI, this option is called “Publish to web”. Keep in mind, that a link will be generated if using this method, and the link is accessible to anyone. Also, by paying for the Pro license, the creator can set up automated data refreshing which is a useful feature.

If we imagine that the report is too sensitive to be shared with everyone, the end user of the report will need to pay for a license. The end user will have to purchase either a Pro or Premium license, and this applies to each end user. For example, if a business has five employees who all should have access to the report, five licenses are required.

The creator can also purchase a Premium Per User (PPU) license. It is essentially the same as the Pro license but offers more advanced capabilities like AI, refreshing each report 48 times per day, more memory consumed by the Power BI report etc.

Prices for the licenses

At the time of writing this post – February 2024 – the prices are:

  • Free: $0
  • Pro: $10 per user per month
  • Premium Per User: $20 per user per month

Capacity license

Above, we have discussed the licensing question from a creator and end user perspective. There is also a licensing question to be discussed for the so called “Power BI capacity”. This is essentially a shared destination where reports reside and can be thought of as a server, but it is in the cloud. Now, if a business purchases a Premium capacity, it changes the answers to what we discussed above.

The largest benefit of having the Premium capacity, is that it is possible to share with all users that you want to share the report with, and there is no need for the end users to have any license at all. There are some other benefits as well, for example the business can take control of the reporting and own it themselves. If a Premium capacity is not purchased, the creator and end user will need to have what is called a Shared capacity, hence the creator has access to the report also after publication. There are ways to solve that, for example the end user can revoke the access for the creator.

Admittedly, the Premium capacity is a costly solution, and currently it starts at $4,995 per month. That is approximately 500 Power BI Pro licenses, so that is about how many users are needed for this solution to make sense. However, administration of these 500 Pro licenses will also be demanding, so we will argue that the Premium capacity is useful before having that many users. It also enables nicer solutions, but there is certainly a minimum number of users before it really makes sense to buy it.

Considerations on how to share Power BI reports

In mathematics, there is the concept of necessity and sufficiency (link for more background). For example, it is necessary for a team to be qualified for the World Cup in order to win the championships. It is not sufficient, however, just to be qualified. To win the World Cup, it is necessary to win the final. By definition, the winner of the final is the World champion, so it is also sufficient.

If you are a business or private person who just wants to display non-sensitive data to the rest of the world, in the form of a live Power BI report, a Pro or Premium license can be sufficient. It is also necessary to have a Pro or Premium license to be able to share the report. As soon as it is sensitive information, however, having a Pro or Premium license only for the creator, is not sufficient. It is still necessary, however, to have at least a Pro license for the creator. As we can see, there are many scenarios to consider. The table below summarises in which scenarios the report can be shared in case there is no Premium capacity, that is, they are using a shared capacity.

Licenses needed in order to share Power BI reports
Can a live version of the report be shared? If there is no Premium capacity

In the table above, * means that in the case of the creator having a Pro/Premium license, it is possible to “Publish to web”, meaning that it will be freely accessible at Internet. For businesses, this is typically not an option, hence this is categorised as No, but we still mention this as an exception. The table below summarises in which scenarios the report can be shared in case there is a Premium capacity.

Licenses needed in order to share Power BI reports
Can a live version of the report be shared? If there is a Premium capacity

Summary

We have learnt what is needed from the creator’s and the end users’ perspectives in order to share Power BI reports. To summarise, for small businesses, at least a Power BI Pro license is needed for the creator and likely also for each end user. For large businesses, the same setup can be valid, but they should also look into having a Power BI Premium capacity, which is a bit costly but which drastically reduces the number of licenses needed. We also learnt some workarounds on how to share Power BI reports, for example to share the PBIX file between users.

More blog posts

On the development of the SEK exchange rates & bond yields in Q3 2025

We analyse the development of the SEK exchange rates & bond yields in Q3 2025. We use a Power BI...

On the development of SWESTR in Q3 2025

We analyse the development of the SWESTR in Q3 2025. We use a Power BI report and also review the...

Reading monetary policy data from the Riksbank via REST API

We analyse the development of the SWESTR in May 2024. We use a Power BI report and also review the...

On the development of SWESTR in May 2024

We analyse the development of the SWESTR in May 2024. We use a Power BI report and also review the...

On the development of the SEK exchange rates & bond yields in May 2024

We analyse the development of the SEK exchange rates & bond yields in May 2024. We use a Power BI...

On the development of the SEK exchange rates & bond yields in April 2024

We analyse the development of the SEK exchange rates & bond yields in April 2024. We use a Power BI...

On the development of the NOK exchange rates & bond yields in March and Q1 2024

We analyse the development of the NOK exchange rates & bond yields in March and Q1 2024. We use a...

On the development of SWESTR in March and Q1 2024

We analyse the development of the SWESTR in March and Q1 2024. We use a Power BI report and also...

On the development of the SEK exchange rates & bond yields in March and Q1 2024

We analyse the development of the SEK exchange rates & bond yields in March and Q1 2024. We use a...

How to share Power BI reports Read More »

On the development of the NOK exchange rates in January 2024

Blog

On the development of the NOK exchange rates in January 2024

In this blog post, we will analyse the development of the Norwegian krone (NOK) exchange rates in January 2024. We will use a Power BI report that is available in our Portfolio.

The source of all data is the Norwegian central bank – Norges Bank.

January 2024 overview

We start by going to this page, and change the year filter to 2024. We then expand the table and click on January. Doing so, the rest of the page will update with January as a filter. This is a convenient way of filtering a Power BI page without having actual filters visually present in the report.

Power BI report of NOK exchange rates

We then see that NOK strengthened against three currencies – Australian dollar (AUD), Japanese yen (JPY) and Swedish krona (SEK). Similarly to what we reported for SEK in our blog post, there were no dramatic changes in January. All movements were approximately within the range -2% to +2%. It can be noted here that + means that NOK weakened, and – means that NOK strengthened. For example, if the EUR-NOK exchange rate goes from 10 to 11, that +1 change is a weakening of the NOK.

We note that NOK weakened the most – by 2.0% – against Pound sterling (GBP) and then by 1.7% against the US Dollar (USD). NOK strengthened the most – by 2.2% – against JPY.

Zooming in on the chart of percentual exchange rate development, it will look like below. We see that most of the development happened before approximately 25th January, and after that it was relatively flat.

Percentual change of NOK exchange rates in January 2024

If we compare the NOK development to large currencies like Euro (EUR), GBP, JPY and USD, it will look like below. We see that NOK weakened against all of them except for JPY.

NOK exchange rate development compared to EUR, GBP, JPY and USD

On the other hand, if we compare NOK development to smaller currencies like Brazilian real (BRL) and SEK, it will look like below.

NOK exchange rate development compared to BRL and SEK

Combining the chart of large currencies with this chart of smaller currencies, gives no clear correlation of NOK exchange rate development depending on the popularity of the currency. It can still be an interesting perspective, however, for example to know if NOK is catching up with large currencies or not.

Finally, we go to this page and review a snapshot taken at the 1st February 2024. The exchange rate development, we have discussed above, but looking at this picture, we get more insights on the NOK bond yields development. For example, one could then see if there is a relation between rate increases and stronger NOK.

NOK exchange rates & bond yields

We can see in the picture above that the longer-term NOK government bond yields increased more than the shorter-term bond yields. For example, the 10 years bond yield increased by 27 bps – to 3.52%, but the 3 months bond yield only increased by 1 bps – to 4.52%. We also realise that the 3 months bond yield is 100 bps higher than the 10 years yield.

We also look at the bond spreads, which are the differences in yield between shorter-term bonds and longer-term bonds. For example, a common financial metric is to measure the difference in yield between a 5 years bond and a 10 years bond. This is also called “5s10s” and that bond spread is now at 0.13%. This means that the yield of the 10 years bond is 13 bps higher than the 5 years bond. This is normal and usually investors require higher yield for longer duration as the money are “locked” for a longer time period. We see that the 5s10s bond spread increased by 11 bps in January. Since both of the bonds increased, it means that the 10 years bond yield increased more than the 5 years bond yield.

Summary

In January 2024, there were no dramatic changes of the NOK exchange rates compared to major currencies like GBP, EUR, JPY and USD. NOK weakened by 2.0% against GBP and by 1.7% against USD, while it strengthened by 2.2% against JPY. This is very similar to the SEK development as we described in a previous post.

With regards to bond yields, the NOK bonds with longer duration increased more than the ones with shorter duration. For example, the 10 years bond yield increased by 27 bps while the 3 months bond yield only increased by 1 bps.

More blog posts

On the development of the SEK exchange rates & bond yields in Q3 2025

We analyse the development of the SEK exchange rates & bond yields in Q3 2025. We use a Power BI...

On the development of SWESTR in Q3 2025

We analyse the development of the SWESTR in Q3 2025. We use a Power BI report and also review the...

Reading monetary policy data from the Riksbank via REST API

We analyse the development of the SWESTR in May 2024. We use a Power BI report and also review the...

On the development of SWESTR in May 2024

We analyse the development of the SWESTR in May 2024. We use a Power BI report and also review the...

On the development of the SEK exchange rates & bond yields in May 2024

We analyse the development of the SEK exchange rates & bond yields in May 2024. We use a Power BI...

On the development of the SEK exchange rates & bond yields in April 2024

We analyse the development of the SEK exchange rates & bond yields in April 2024. We use a Power BI...

On the development of the NOK exchange rates & bond yields in March and Q1 2024

We analyse the development of the NOK exchange rates & bond yields in March and Q1 2024. We use a...

On the development of SWESTR in March and Q1 2024

We analyse the development of the SWESTR in March and Q1 2024. We use a Power BI report and also...

On the development of the SEK exchange rates & bond yields in March and Q1 2024

We analyse the development of the SEK exchange rates & bond yields in March and Q1 2024. We use a...

On the development of the NOK exchange rates in January 2024 Read More »

Analysing website performance using Power BI and Google Analytics

Blog

Analysing website performance using Power BI and Google Analytics

In this blog post, we will analyse website performance using Power BI and Google Analytics (GA4) data. We do so by using an existing report, which is available in our Portfolio, and it is called Website statistics. For information, we described in a previous blog post how to connect Power BI and Google Analytics.

Introduction of website analytics using Power BI and Google Analytics

The report connects Power BI and Google Analytics, and we are using the GA4 connector to do so. It is a rather simple report with just one page, and the purpose is to show effectively a snapshot of the most important website metrics. Using the Power BI online service, we have set up automatic refreshing of the GA4 data. For more information about Google Analytics, we refer to this page.

The default view presents the performance in the Current month, but it is possible to go back in time to review the month of interest. We measure the following metrics:

  • Sessions
  • Bounce rate
  • Hits
  • Visitor type
  • Visitor source
  • Seconds spent per page

They are visualised from different perspectives, for example, the sessions can be seen per day and per city and they are also compared to the last month.

Example of a report using Power BI and Google Analytics


Quick introduction of the measured metrics

We will here go through the interpretation of the metrics used in the report and justify why they are measured.

Sessions is the most basic website metric, and basically measures all traffic coming to your website. It is the starting point of all website analytics.

Bounce rate means that only one page is visited for a specific session. Typically, it is desired to keep the visitor engaged and have the visitor visit multiple of your pages. We measure this because we want to ensure our full website content is shown to the visitor.

Hits measures the number of user interactions. For example, a user clicking on the link to another page would imply one hit. Similarly to bounce rate, we want to ensure that our content and message are displayed to the visitor.

Visitor type measures if it is a New user or an Existing user that is coming back to your site. This is important to measure, because it needs to be aligned with your business intentions. For example, if you want to attract new customers, you would like to see New users visiting the site.

Visitor sources measures from where the traffic originates. For example, direct means that the visitor knows your URL and has visited your site directly. This is an important metric as it shows how well your marketing campaigns and marketing outreach are working.

Analysis

In this chart, we see the number of sessions for each day. With the line, we are also able to see the accumulative number of sessions throughout the month. For example, we see that approximately from day 11 to day 20, there was no traffic at all.

Sessions per day
Sessions per day

We present three high-level KPIs and compare them to the last month. The first KPI is the number of sessions which were up by 76%, compared to the last month, which is a large change. Then there is the bounce rate, which means that in the month, on average, 27% of the sessions only had one page visited. Ideally, here we would like to see a low %, as we would like the user to visit several pages. Then, we see with the hits, that on average 0.3 user interactions happened per session. This was an increase by 8% compared to the last month.

High-level website performance metrics

If we then move on to more in-depth KPIs, we see a distribution of the sessions by the city they originated from.

Distibution of traffic per city

When reviewing where visitors spend their time, we see that the Portfolio page was, by far, the page that the visitors spent the most time at.

Time spent per page
Time spent per page

Next, we see that 57% were New users and 43% were Returning users. We consider this a healthy balance, but it also is very specific for each site’s business intentions. We also see that we had two types of traffic sources – direct and via Google, where direct traffic dominated at 67% of all traffic.

Visitor type and visitor source

Summary

We used a Power BI report to analyse website performance. In addition, we looked at common website metrics like sessions, visitor types, visitor sources etc. and learnt why they are important to measure. By using Power BI and Google Analytics data together, we can tailor our analysis exactly how we want it, but there are also possibilities to use other tools, like the built-in charts in Google Analytics’ web tool.

More blog posts

On the development of the SEK exchange rates & bond yields in Q3 2025

We analyse the development of the SEK exchange rates & bond yields in Q3 2025. We use a Power BI...

On the development of SWESTR in Q3 2025

We analyse the development of the SWESTR in Q3 2025. We use a Power BI report and also review the...

Reading monetary policy data from the Riksbank via REST API

We analyse the development of the SWESTR in May 2024. We use a Power BI report and also review the...

On the development of SWESTR in May 2024

We analyse the development of the SWESTR in May 2024. We use a Power BI report and also review the...

On the development of the SEK exchange rates & bond yields in May 2024

We analyse the development of the SEK exchange rates & bond yields in May 2024. We use a Power BI...

On the development of the SEK exchange rates & bond yields in April 2024

We analyse the development of the SEK exchange rates & bond yields in April 2024. We use a Power BI...

On the development of the NOK exchange rates & bond yields in March and Q1 2024

We analyse the development of the NOK exchange rates & bond yields in March and Q1 2024. We use a...

On the development of SWESTR in March and Q1 2024

We analyse the development of the SWESTR in March and Q1 2024. We use a Power BI report and also...

On the development of the SEK exchange rates & bond yields in March and Q1 2024

We analyse the development of the SEK exchange rates & bond yields in March and Q1 2024. We use a...

Analysing website performance using Power BI and Google Analytics Read More »

On the development of the SEK exchange rates in January 2024

Blog

On the development of the SEK exchange rates in January 2024

In this blog post, we will analyse the development of the SEK exchange rates in January 2024. We will use a Power BI report that is available in our Portfolio. In case you are interested in an analysis over a longer time period, we have previously written a blog post about that.

The source of all data is the Swedish central bank – the Riksbank.

January 2024 overview

We start by going to this page, and change the year filter to 2024. We then click on January in the table. A good feature with Power BI, is that it is dynamic and by clicking on January, the rest of the page updates with January as a filter.

SEK exhange rates overview
Overview of SEK exchange rates in January 2024

We then see in the chart on the top left, that SEK only strengthened against one of the currencies – Japanese yen (JPY) – out of the ones present in the report. We also see that there were no dramatic changes in January, and all movements were approximately within the range -2% to +3%. It can be noted here that + means that SEK weakened, and – means that SEK strengthened. For example, if the EUR-SEK exchange rate goes from 10 to 11, that +1 change is a weakening of the SEK.

We note that SEK weakened the most against Pound sterling (GBP) at 2.4% and then with 2.1% against the US Dollar (USD). The SEK barely changed against CHF (+0.6%) and NOK (+0.4%).

Zooming in on the chart of percentual exchange rate development, it will look like below. We see that in the very last days of January, there was a strengthening of the SEK against all currencies.

SEK exchange rate development
Percentual change of SEK exchange rates

If we review the movements of the SEK 5 and 10 years bond yields, and compare to the development of the same for USD respective GBP, we also see no dramatic movements that could explain the exchange rate development. In addition, we see that the SEK bond yields were all up in January, for example the 10 years yield went from 2.11% to 2.22%.

SEK exchange rate and bond yields development compared against USD
SEK exchange rates and bond yields development compared against GBP

Finally, we dive a bit deeper in regards to the bond yields. Using the two pictures above, we see (in Power BI only) that the USD 5 years bond went from 3.92% to 3.84% (-8 bps) in January while the SEK 5 years bond went from 2.01% to 2.16% (+15 bps). Conversely, the GBP 5 years bond yield went from 3.55% to 3.74% (+19 bps), which is more in line with the SEK equivalent.

Summary

In January 2024, there were no dramatic changes of the SEK exchange rates compared to major currencies like GBP, EUR and USD. SEK weakened by 2.4% against GBP and by 2.1% against USD, while it strengthened by 1.8% against JPY.

With regards to bond yields, the SEK 5 years yield increased by 15 bps. That can be compared to the USD 5 years yield that decreased by 8 bps and the GBP equivalent which increased by 19 bps.

More blog posts

On the development of the SEK exchange rates & bond yields in Q3 2025

We analyse the development of the SEK exchange rates & bond yields in Q3 2025. We use a Power BI...

On the development of SWESTR in Q3 2025

We analyse the development of the SWESTR in Q3 2025. We use a Power BI report and also review the...

Reading monetary policy data from the Riksbank via REST API

We analyse the development of the SWESTR in May 2024. We use a Power BI report and also review the...

On the development of SWESTR in May 2024

We analyse the development of the SWESTR in May 2024. We use a Power BI report and also review the...

On the development of the SEK exchange rates & bond yields in May 2024

We analyse the development of the SEK exchange rates & bond yields in May 2024. We use a Power BI...

On the development of the SEK exchange rates & bond yields in April 2024

We analyse the development of the SEK exchange rates & bond yields in April 2024. We use a Power BI...

On the development of the NOK exchange rates & bond yields in March and Q1 2024

We analyse the development of the NOK exchange rates & bond yields in March and Q1 2024. We use a...

On the development of SWESTR in March and Q1 2024

We analyse the development of the SWESTR in March and Q1 2024. We use a Power BI report and also...

On the development of the SEK exchange rates & bond yields in March and Q1 2024

We analyse the development of the SEK exchange rates & bond yields in March and Q1 2024. We use a...

On the development of the SEK exchange rates in January 2024 Read More »

How to read data from Google Analytics to Power BI

Blog

How to read data from Google Analytics to Power BI

In this blog post, we will learn how to connect Google Analytics to Power BI, using the latest version of Google Analytics called GA4. For information, we discussed in a previous blog post how to connect Power BI to a database using a REST API. Google Analytics uses another technology, however, which we will go through here. The post assumes that you have a Google account set up, and that you are tracking statistics for your website.

Introduction to Google Analytics

Google Analytics is a popular tool for analysing traffic on websites. More specifically, it is possible to track user behaviours on your website and learn more about how your content caters to your audience. For example, you can see how certain pages perform in terms of making the user stay at the page. You can then learn which type of content performs well. It is also possible to see from which country and city that your traffic originates from.

You can also see how much your users interact with your website. For example, if much of your traffic only arrives at the start page and then have no further interactions, it could indicate some problems with your website. It could also mean that it is very important that you optimise your message to be shown efficiently on that start page.

It is also possible to see if the traffic originates from new visitors or previous visitors. Again, this could impact how you want to position your content, what content you shall develop and it could infleunce your marketing strategies as well. For example, if your traffic only consists of previous visitors, it could indicate that you need to attract new visitors. Here is some further information on Google Analytics in general.

Introduction to Google Analytics in Power BI

In order to connect to all the data that exists in the Google Analytics environment, there is a special connector developed for the purpose. There are two versions of the connector – 1.0 and 2.0 (Beta). The 1.0 version is related to a previous Google Analytics version called Universal Analytics. In 2023, Google released its new version called Google Analytics 4 (GA4). The version called 2.0 (Beta) supports GA4, so we will use that in our guideline. For more information on the Power BI connector, please see Microsoft’s website.

Connecting Google Analytics to Power BI

We start by opening Power BI and go to Get data. It will look like this, and then the user selects “More…”.

Get Data Power BI
Get data in Power BI

Then we search for Google, select Google Analytics and click on Connect.

Google Analytics data to Power BI
Google Analytics connector in Power BI

Next, we choose 2.0 (Beta) because we want to use the GA4 version of the connector.

GA4 connector in Power BI
GA4 version of the connector in Power BI

We then are asked to sign in to our Google account in the web browser.

After having logged in, we are able to select from several KPIs and we can also select from which aspect we want to measure said KPIs. For example, we here select sessions which is one of the most basic measurements. Basically, sessions means all traffic (sessions) that have been appearing at your website. Next, we select that we want to measure sessions by date and country. This way, we will be able to see the traffic numbers for each day, and we can see how much of the traffic that originates from each country.

Select the desired data points that Power BI shall read from Google Analytics

We click on Load, and the data will look like below. We can note that the data is shown in a summarised way. For example, it says Ireland and for a specific day, there were 20 sessions. This is a more efficient way than showing each session specifically. However, as we bring in more dimensions, we will get more columns and rows of data which will impact performance. For example, if we are to add city, perhaps 5 sessions are from a certain city, 10 are from another city etc. So it would change the data structure.

GA4 data in Power BI
Example of what GA4 data can look like in Power BI

It can be a good idea to think through what you want to analyse and from what perspective. Depending on how much web traffic data that your site has, what kind of data you want to read will influence the performance of the Power BI report. The Google Analytics connector in Power BI also has a limit of 10 KPIs per data query. A way to get around that is to have multiple queries, but with each KPI and query added the Power BI performance will be impacted. If your site focuses on keeping existing visitors, your analysis can start with reading much data related to existing visitors in one query. You can then complement it with other KPIs in a second query, for example.

Summary

In this blog post, we discussed some benefits of using Google Analytics 4 (GA4) data to analyse your website performane. We also learnt how to connect Google Analytics to Power BI, by using the built-in connector. More specifically, we learnt how to use the connector for GA4, which is the most recent version of Google Analytics. Finally, we reviewed some data and discussed what GA4 data is relevant to analyse and some limitations of the GA4 connector.

More blog posts

On the development of the SEK exchange rates & bond yields in Q3 2025

We analyse the development of the SEK exchange rates & bond yields in Q3 2025. We use a Power BI...

On the development of SWESTR in Q3 2025

We analyse the development of the SWESTR in Q3 2025. We use a Power BI report and also review the...

Reading monetary policy data from the Riksbank via REST API

We analyse the development of the SWESTR in May 2024. We use a Power BI report and also review the...

On the development of SWESTR in May 2024

We analyse the development of the SWESTR in May 2024. We use a Power BI report and also review the...

On the development of the SEK exchange rates & bond yields in May 2024

We analyse the development of the SEK exchange rates & bond yields in May 2024. We use a Power BI...

On the development of the SEK exchange rates & bond yields in April 2024

We analyse the development of the SEK exchange rates & bond yields in April 2024. We use a Power BI...

On the development of the NOK exchange rates & bond yields in March and Q1 2024

We analyse the development of the NOK exchange rates & bond yields in March and Q1 2024. We use a...

On the development of SWESTR in March and Q1 2024

We analyse the development of the SWESTR in March and Q1 2024. We use a Power BI report and also...

On the development of the SEK exchange rates & bond yields in March and Q1 2024

We analyse the development of the SEK exchange rates & bond yields in March and Q1 2024. We use a...

How to read data from Google Analytics to Power BI Read More »

A closer look at the Swiss tourism sector using Power BI for data analysis

Blog

A closer look at the Swiss tourism sector using Power BI for data analysis

In this blog post, we will look at Swiss tourism from a numerical perspective. We will use data that is provided by Switzerland Tourism. The data is read directly to Power BI by using their REST API, and the data is updated three times per day. Switzerland Tourism is an organisation that works with promoting tourism in Switzerland. On their website, they present information about Switzerland, and they also list current accommodation deals for example.

Introduction to the Power BI report

Using the REST API, we can read all of the accommodation deals instead of having to browse the site. We can then visualise it in our own ways and filter as we prefer. The API also offers the possibility to read information about Switzerland’s extensive possibilities for activities like skiing in the Alps, hiking, biking etc. We have a previous blog post which explains more on how to read data from a REST API to Power BI.

In our Portfolio, we have a report, called “Report of available offers”, which looks at all the current offers listed on Switzerland Tourism’s website. These offers are mostly accommodation deals, but they can also be one-day conference offers at reduced price as an example. We also have a page with information about the different activities, typically outdoor activities, that are found in Switzerland.

Using the report for analysis

Starting with the available offers, we have created a simple page, which is seen below, consisting of:

  • Two filters – Price and Location
  • One chart – When do the offers expire?
  • Four numerical KPIs
  • One map – To show where the offers can be found
Power BI report using data from Switzerland Tourism

According to the data read from Switzerland Tourism, there are 4 083 destinations, such as hotels, hostels, bed-and-breakfasts, etc. across Switzerland. We can see that there are 194 active offers listed at myswitzerland.com. We also see that there are 136 destinations, out of 4 083, that have at least one active offer. This means that there are some destinations that have multiple offers active at the same time. Dividing the 136 destinations that have an active offer by the total number of destinations – 4 083 – we see that 3% of the destinations have at least one active offer. There is also the possibility that there are more offers, offered only locally on hotels’ websites etc., but the numbers used here are the ones listed on Switzerland Tourism’s website.

We also see in the chart to the right that most offers expire during the spring in 2024. This is reasonable for two reasons. First, the skiing season in the spring time is quite popular in Switzerland so there will be many offers related to skiing. Second, it is common not to publish offers too far in advance, so mostly “near-term” offers will be listed.

We also offer the possibility to filter by price. For example, if we want to find offers below 150 CHF, the page will be updated and look like this. As can be seen in the picture below, there are 30 such offers currently available.

Accommodation deals in Switzerland below 150 CHF

We can hover over the map and get some additional information for each destination, like is shown below.

Using the map visualisation in Power BI

Our report is updated three times per day, and we could have chosen to update it even more frequently. It is interesting to see how data is being used within the (Swiss) tourism sector, and we see a few interesting use cases. For example, a hotel could set up this data pipeline in order to monitor what their competitors are offering, respective not offering, and what are the current price levels.

Find offers by location – Luzern as an example

We can also filter by location. Here we filter in order to find available offers in Luzern. There are three offers available at the moment in Luzern.

Offers in Luzern listed at Switerland Tourism's website
Offers in Luzern listed at Switerland Tourism’s website

Skiing, hiking and biking in Switzerland

We also read data over available tours in Switzerland, which are for example skiing, hiking and biking tours, but also categories like “City Breaker” and “Family” are available. In this post, we will analyse the data behind the hiking tours found in Switzerland. So, we start by using the filter Tour type and set it to “Outdoor Enthusiast – Hiker”.

Hiking tours in Switzerland

Each tour comes with a location, name and description. This way, we are able to visualise on the map where it is located, and the user can also hover to read more information about the tour.

Each tour also has a certain length and ascent listed in the data stream. This way, we are able to visualise the different lengths and ascents. For example, the users might be looking for a tour length between 10 and 20 km. We can see in the chart above that there are 325 such tours.

Each tour is also classified with respect to the endurance level and technical level required. Typically, long tours with much ascent will be classified as Difficult both with respect to endurance and technical levels needed. Vice versa, a short tour with little ascent will typically be classified as Easy with respect to the endurance and technical levels needed. For example, if we filter by Difficult endurance level, the page will look like this.

Hiking tours at Difficult endurance level

We see that there are 303 difficult tours, and we note that the average distance is 35 km while the average ascent is 1 720 meters. A great way to use the dynamics of Power BI, is to click on a chart and then filter the rest of the page. Here, we filter by clicking on the 20 – 40 km distance range in the chart. We then see, in the picture below, that there are 120 tours in this range. The average distance as well as the average ascent changed – to 25 km and 902 m, respectively. The chart with the distribution of the ascents also updated, to visualise what are the ascents of these 120 tours.

Difficult hiking tours in Switzerland with a length of 20 to 40 km

Conversely, we can do the opposite. Suppose we want to find a tour with an ascent of at most 300 meters. We then see that there are only 19 such tours, which at the same time are at a Difficult endurance level.

Hiking tours with an ascent below 300 meters and at a Difficult endurance level

Summary

In this post we have used a Power BI report to look at data related to the Swiss tourism sector. We also explored how the map visualisation can be filled with information in Power BI. In addition, we learnt how to dynamically filter a page by clicking on the data point of interest, in this case the Endurance and Ascent parameters. Finally, we hope that you find the report useful when planning your next trip to Switzerland.

More blog posts

On the development of the SEK exchange rates & bond yields in Q3 2025

We analyse the development of the SEK exchange rates & bond yields in Q3 2025. We use a Power BI...

On the development of SWESTR in Q3 2025

We analyse the development of the SWESTR in Q3 2025. We use a Power BI report and also review the...

Reading monetary policy data from the Riksbank via REST API

We analyse the development of the SWESTR in May 2024. We use a Power BI report and also review the...

On the development of SWESTR in May 2024

We analyse the development of the SWESTR in May 2024. We use a Power BI report and also review the...

On the development of the SEK exchange rates & bond yields in May 2024

We analyse the development of the SEK exchange rates & bond yields in May 2024. We use a Power BI...

On the development of the SEK exchange rates & bond yields in April 2024

We analyse the development of the SEK exchange rates & bond yields in April 2024. We use a Power BI...

On the development of the NOK exchange rates & bond yields in March and Q1 2024

We analyse the development of the NOK exchange rates & bond yields in March and Q1 2024. We use a...

On the development of SWESTR in March and Q1 2024

We analyse the development of the SWESTR in March and Q1 2024. We use a Power BI report and also...

On the development of the SEK exchange rates & bond yields in March and Q1 2024

We analyse the development of the SEK exchange rates & bond yields in March and Q1 2024. We use a...

A closer look at the Swiss tourism sector using Power BI for data analysis Read More »