Blog
A closer look at the SEK exchange rate development using Power BI
In this blog post, we are going to go behind the scenes of the development of two reports available in our Portfolio. These reports read data from the Swedish central bank – the Riksbank – directly to Power BI. We do so by utilising the REST APIs provided by the Riksbank. REST API stands for REpresentational State Transfer API, and it is a common way of structuring and accessing data in a programmatic way.
Background on REST APIs
Some REST APIs have security measures in place, so that only authorised users can access the data. The user then has to send credentials by using the API, and if they are verified correctly, data can be read. With the Riksbank’s API it is not required with credentials. Hence, this guide is going to skip that part, and we are only reading, not writing, data when using the API. We are going to access interest rates for the SWESTR which is a reference rate with short duration (overnight rate). For more information about SWESTR, please see the Riksbank’s website.
Our Power BI report, called Swedish krona (SEK) exchange rates & bond yields, presents the SEK performance against an array of currencies. It also presents the SEK bond yields as well as the bond yields for select currencies. The data is read from the Swedish central bank – the Riksbank – and it goes back to 2010. We will here review the SEK exchange rate performance.
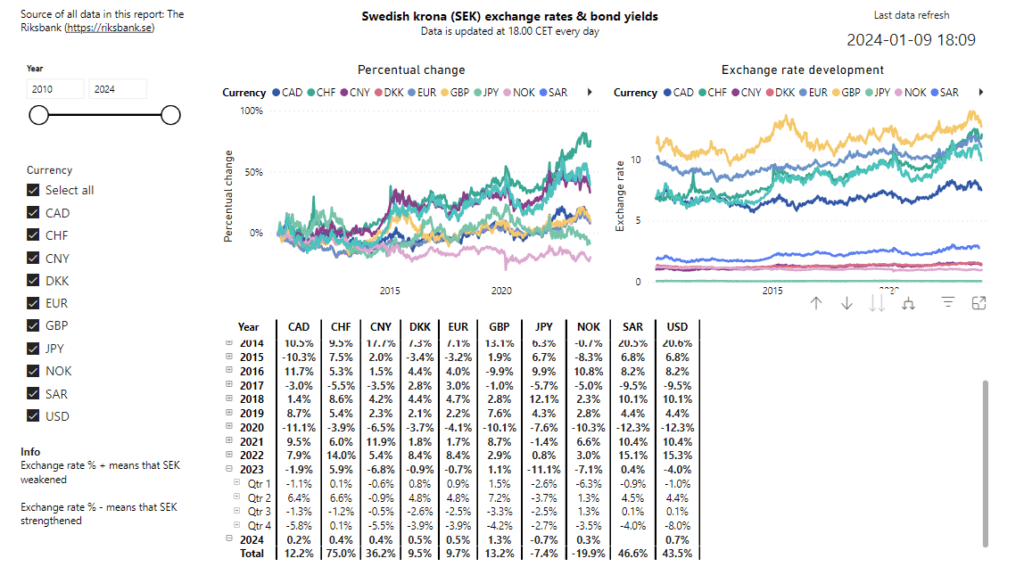
To start with, the report has a table with quarterly development since 2010. The user can expand to see the performance either per quarter or per month.

The total development since 2010 is presented and some highlights are:
- SEK has strengthened vs JPY by 7%
- SEK has strengthened vs NOK by 20%
- SEK has weakened vs CHF by 75%
- SEK has weakened vs EUR by 10%
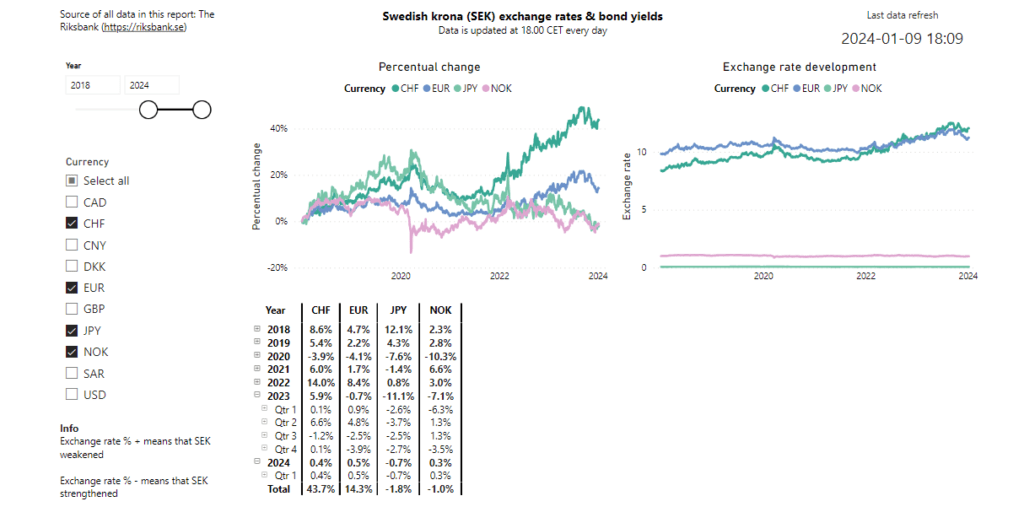
We also present a chart and a filter possibility with respect to the date range and currencies of interest. Here, the user wants to review SEK performance vs JPY, NOK, CHF and EUR since 2018.

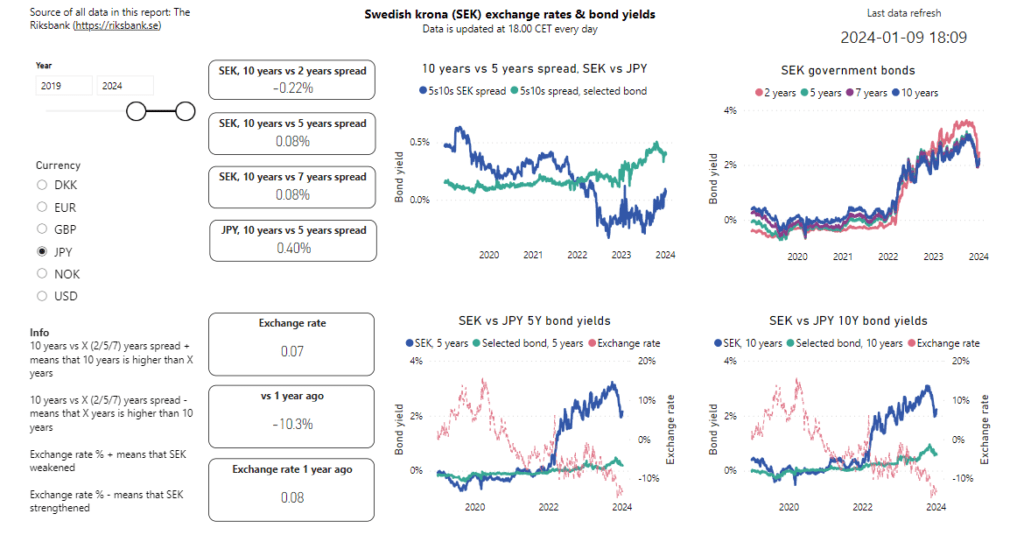
To further help the user understand possible reasons behind the development, the report presents the bond yields for the currencies where such data is available. For example, here the user reviews JPY and SEK bond yields since 2019. Also the so called “bond spreads”, in this case the difference between 10 years yield and 5 years yield, are presented. If, for example 5 years yield is much higher than the 10 years yield, one scenario could be that investors might skip investments in the 10 years as the 5 years offers higher yield with shorter “lock-up” period. In addition, the exchange rate development is overlaid in two of the charts, in order to show the correlation between bond yields and exchange rate for the selected currencies.

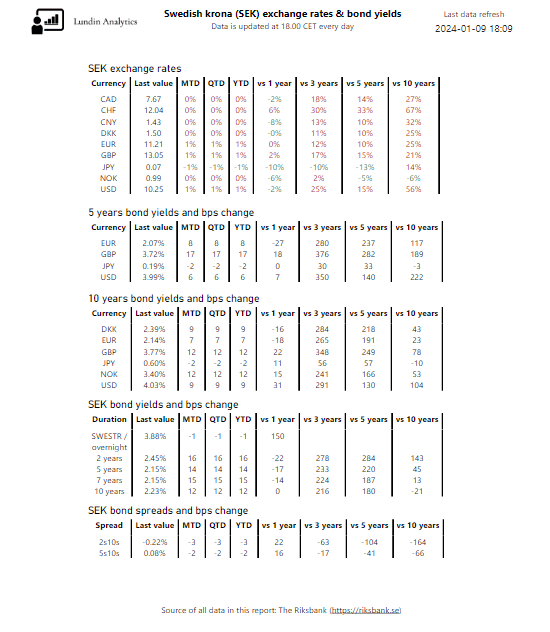
Finally, the report ends with an extensive summary page. The development is evaluated in many different time periods, for example quarter-to-date (QTD), vs 1 year ago, vs 5 years ago and vs 10 years ago. This gives both an emphasis on the more recent values but also gives some history without the need of adding charts.


