Blog
A closer look at the NOK exchange rate development using Power BI
In this blog post, we will elaborate on the Norwegian krone (NOK) exchange rate development by using Power BI. In our Portfolio, we have built a report which presents NOK exchange rates and bond yields. The data is read from Norges Bank directly to Power BI using their REST API. REST API stands for REpresentational State Transfer API, and it is a common way of structuring and accessing data in a programmatic way.
Introduction to the Power BI report
Our report, called Norwegian krone (NOK) exchange rate & bond yields, presents the NOK performance against an array of currencies. For example, the NOK exchange rate against Canadian Dollar (CAD), Euro (EUR) and US Dollar (USD) are presented. In addition, the NOK bond yields for the government bonds are presented. Finally, the so called “bond spreads” are presented. Bond spread refers to the difference in yield between a short-term bond and a long-term bond. More information about bond spreads is found below.
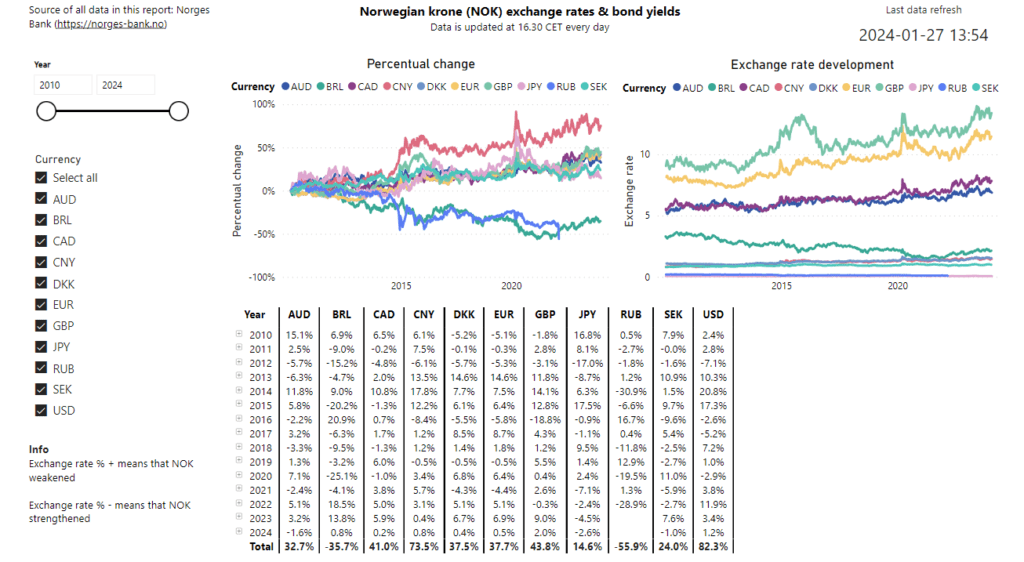
To start with, the user can compare the percentual and actual development of exchange rates. It is possible to select which currency to compare with, and the time interval can be selected. In our report, we have decided to read data starting from Jauary 2010, but Norges Bank provides data even earlier than that. Monthly and quarterly changes are presented in the matrix for each currency which can be seen below.

NOK performance highlights
The total development since 2010 is presented and some highlights are:
- NOK has strengthened vs BRL (Brazilian real) by 36%
- NOK has weakened vs GBP by 44%
- NOK has weakened vs USD by 82%
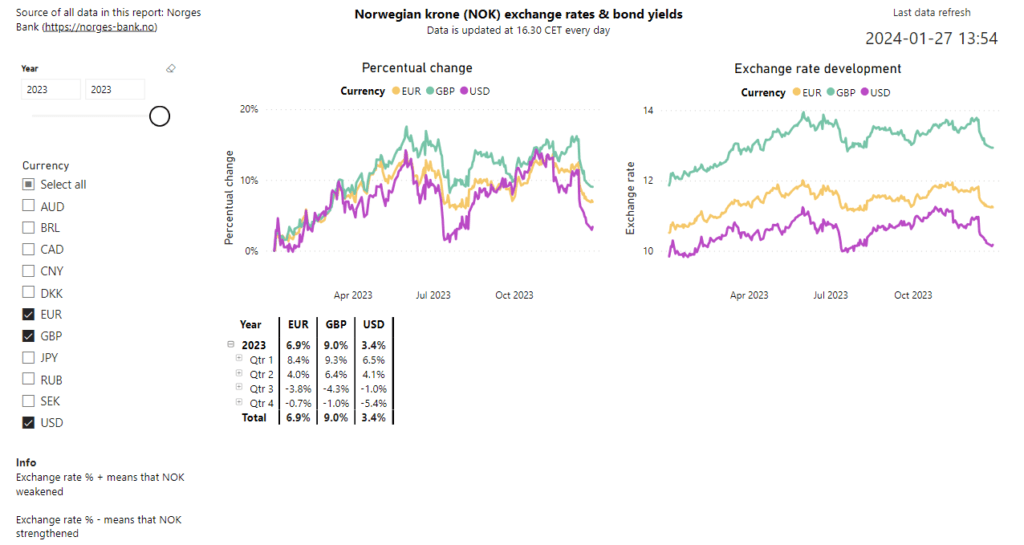
To further zoom in on the performance, in the picture below, we have filtered the page on the year 2023 and only selected EUR, GBP and USD for analysis.

To give the user some background on the exchange rates development, we also present bond yields and bond spreads. For example, increases in the NOK government bond yields might correlate with a stronger NOK and vice versa.
Bond spreads
The bond spread is an important measure, as it typically tells how much of a premium you can get by lending your money for a longer time span. For example, if the 3 years bond yield is 3.0% and the 10 years yield is also 3.0%, investors might think there is no reason to “lock” the money for 10 years and could rather go for the shorter time span. On the other hand, a large bond spread, which could happen if the 3 years yield is at 3.0% and the 10 years yield is at 5.0%, could indicate that there are large risks with the 10 years yield, which could scare investors.
Summary page in Power BI
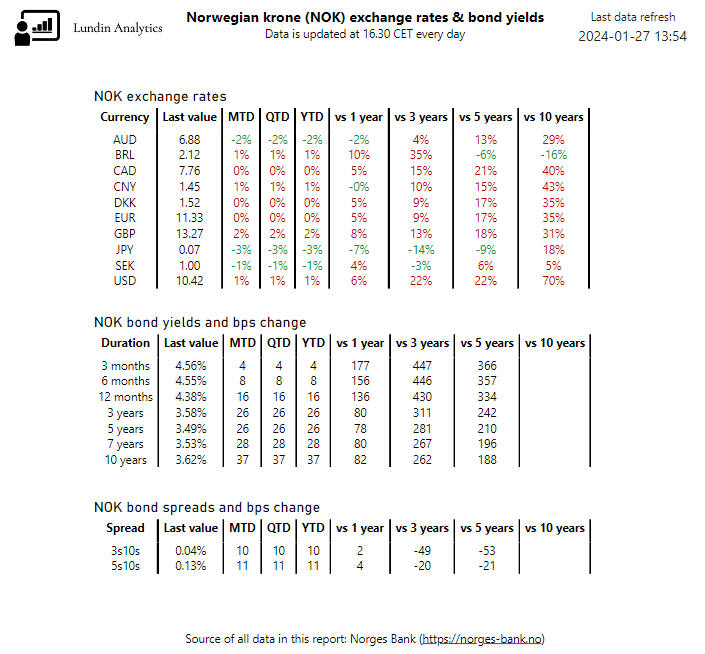
We present a summary page with NOK exchange rates and an extensive summary of NOK bond yields. The durations of the bonds span from 3 months all the way to 10 years. Finally, we present bond spreads in terms of differences between the 10 years yield and the 3/5 years yields. The development is evaluated in many different time periods, for example quarter-to-date (QTD), vs 5 years ago and vs 10 years ago. Hence, it gives a compressed historical view as well as an emphasis on the current values. It is an efficient Power BI visualisation which provides an overview of the most important measures with regards to exchange rates and bond yields development.

For more information on how Norges Bank shares open data, for example related to exchange rates, securities and interest rates, please see their website.

