Blog
How to create a hierarchy in Power BI
In this blog post, we will learn how to create a hierachy in Power BI. This can be useful for example when analysing sales within different categories. The sales can then be measured and analysed for all the categories in an efficient way.
Another example, which we will go through, is how to create a date hierarchy in Power BI. This is convenient for the user because it is then easy to analyse performance per Year, Quarter, Month and Day and easily switch between these perspectives.
How to create the hierarchy
Just like in a previous post, where we discussed the streaming of GA4 data to Power BI, we can continue the example of the e-commerce business. The e-commerce business measures sales at various levels. The levels and their possible values are:
- Level 1 – Clothing, Watches, Accessories
- Level 2 – Men, Women
- Level 3 – Summer, Winter
Even this relatively simple example leads to several combinations that need to be analysed. A hierarchy will solve this efficiently for us, and we do not have to create specific calculations in order to measure for example “Clothing, Women, Summer” performance.
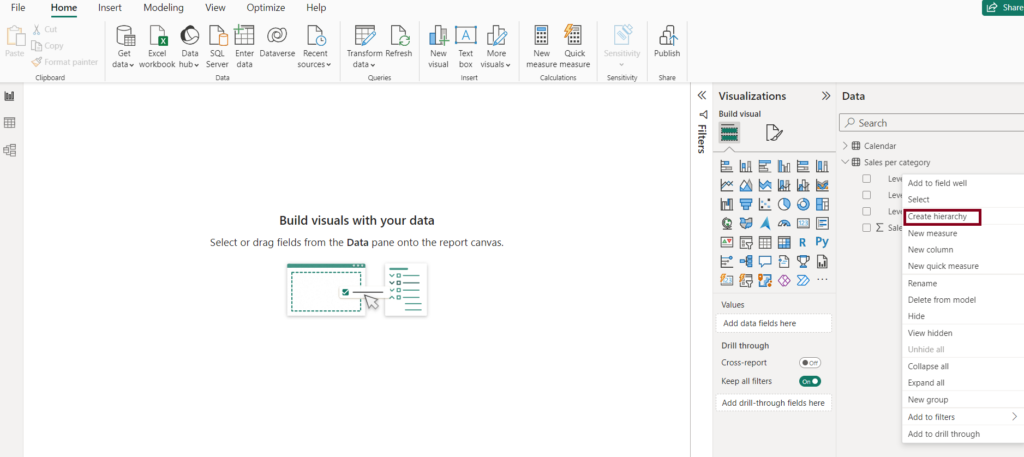
To start with, we go to the Home tab in Power BI, and then we right-click on the Level 1 column where we select “Create hierarchy”.
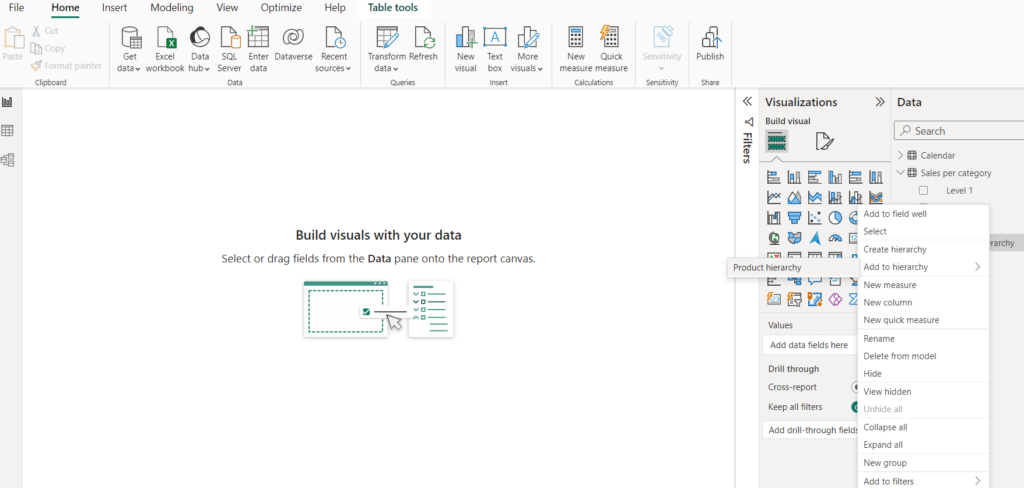
We then rename the hierarchy to “Product hierarchy”, right-click on Level 2 and add it to Product hierarchy. We also do the same for the Level 3 column.
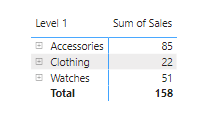
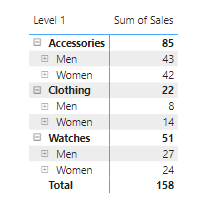
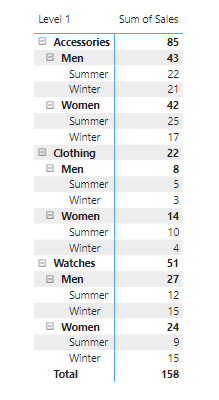
By using a matrix visualisation, we then verify our hierarchy. We add the hierarchy and also the Sales column to the matrix visualisation. By expanding the matrix, we can see in the pictures below what the sales look like for each level.
How to create a date hierarchy
A common use case of hierarchies is to create one that helps you break down your KPIs in different time periods, a so called date hierarchy. Typically, we will have a Calendar table in our Power BI model. We can then create our date hierarchy by the following steps.
First, we decide that we want to replicate this structure in Power BI:
- Year
- Quarter
- Month
- Day
- Month
- Quarter
To start with, we notice that all these four columns exist in our Calendar table. We then right-click on Year, as that is our highest level, and select “Create hierarchy”.
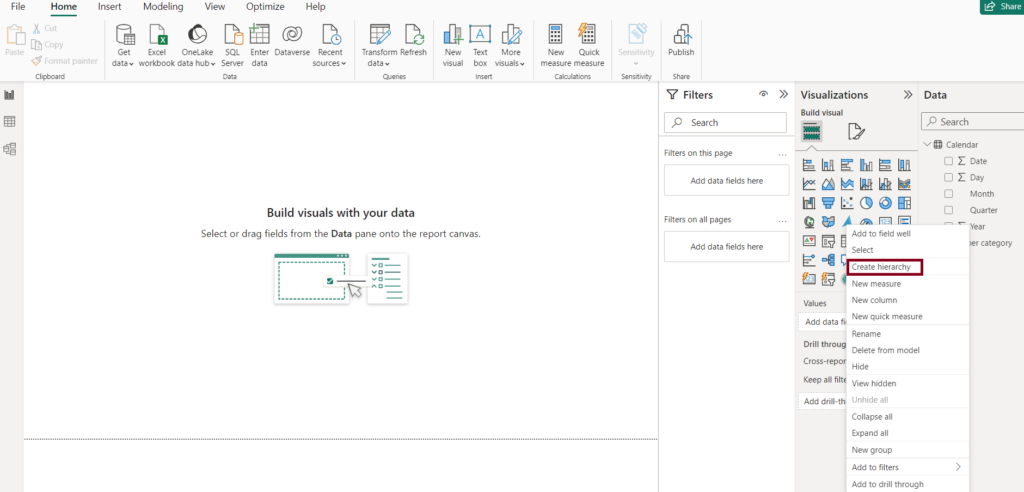
We also right-click on the hierarchy and name it “Date hierarchy”. Finally, we add the Quarter, Month and Day columns to our newly created Date hierarchy. We do so by using the same method that we used above, that is, to right-click and select Add to hierarchy.
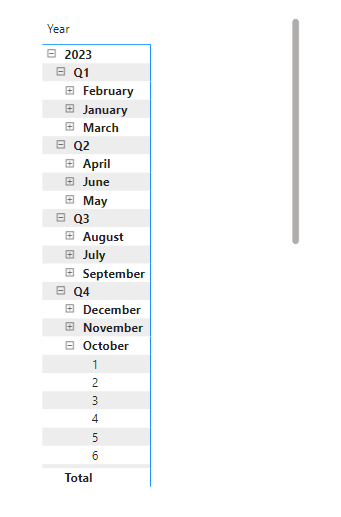
Again, we verify our hierarchy by using a matrix visualisation. We see that we now have a convenient way of switching between Year, Quarter, Month and Day. We also notice that the sorting of the Months is in alphabetic order, which is not optimal. There are ways around that, but that is for another blog post – stay tuned.
Summary
We learnt how to create a hierarchy in Power BI and discussed two examples where this can be useful. A common scenario is to create a Date hierarchy, but it is also useful for other scenarios like the example we discussed, where an e-commerce business wants to analyse their sales by different categories.

