Blog
Exploring data streaming from GA4 to Power BI
In this blog post, we will explore in more detail what kind of data can be read from Google Analytics 4 (GA4) to Power BI. In a previous blog post, we explored how to technically set up the data streaming from GA4 to Power BI.
We also discussed in our previous post that reading Sessions, Bounce rate, Hits, Session duration per page, Visitor source and Visitor type is a good idea. We argue that reading these KPIs is relevant for all businesses.
Google Search Console data to Power BI
It is possible to link Google Search Console (GSC) to GA4. By doing that, we are also able to in turn read the GSC data to Power BI by using the GA4 connection. The benefit of doing this, is that we can not only see the on-site KPIs, but we can also connect it to how our site is performing in Google searches. In addition, thanks to Power BI, we can tailor our reporting to our preferences instead of relying on the report provided by Google in the Search Console. However, the full scope of the GSC data is not available in Power BI, so it is more to be seen as a complement to the regular GSC report.
From GSC, we can read these KPIs which are related to search performance:
- Organic Google Search average position
- Organic Google Search clicks
- Organic Google Search click through rate
- Organic Google Search impressions

Indeed it is a bit limited how many KPIs we can read, but actually the four KPIs above cover the search performance quite well if they are measured in the right ways. That brings us to the next step, where we select in which dimensions we want to measure these KPIs. Here, we have selected country, device category and date. The data will then look like this in Power BI.

E-commerce data in GA4
As an example of what data is available in GA4, we can review some data points that are relevant for e-commerce businesses. Some examples of relevant KPIs for an e-commerce business, together with their definitions, would be:
- Active users – Total number of users on the site
- Checkouts – Number of times that customers started the checkout process
- Cart to view rate – Number of times that a product is added to a cart vs how many times the product is viewed
- Ecommerce purchases – Number of completed purchases
- Gross purchase revenue – Sum of all revenue from purchases
- Purchases conversion rate – % of users who made a purchase
For an e-commerce business, the above KPIs should be measured in the regular dimensions such as:
- City
- Country
- Date
- Device cateogry
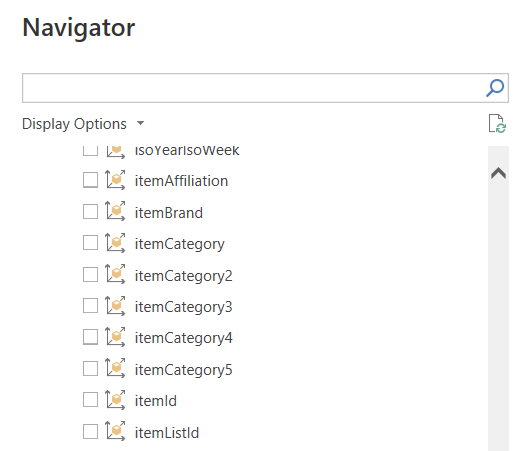
However, for an e-commerce site it is also important to measure the product dimensions to know the sales of each product. These are called Item category and have five levels, called Item category – Item category 5. In addition, you can read Item ID which is a unique ID for each product that you are selling. Here is an example of what the Item categories can represent:
- Item category – Clothing
- Item category 2 – Women
- Item category 3 – Summer
- Item category 4 – Shirts
- Item category 5 – T-shirts
- Item category 4 – Shirts
- Item category 3 – Summer
- Item category 2 – Women
When selecting the dimensions in Power BI, it will look like below.

When measuring for example Active users and Sessions, it is quite insightful to break it down by the hierarchy above. Typically you will have multiple values for each category, so you can then compare your Summer clothing performance to Winter clothing performance, for example.
In our case, we do not sell anything directly at our website, hence we have no checkout. So depending on your business, it wil determine what parts of the GA4 data are relevant for you.
We also quickly realise that it is very important to set up all this analytics properly at your site. For example, you need to have proper definitions of Checkouts, Carts, Purchases etc. mapped so that GA4 knows what triggers these events. A competent web agency can help on that topic.
Summary
We discussed what data points can be read from GA4 to Power BI. More specifically, we showed how to read Google Search Console data to Power BI by using the GA4 connector. This way, it is possible to read some limited search traffic data to Power BI, which can be a complement to your normal Google Search reports.
We also discussed examples of data points that are relevant for-e-commerce businesses and showed how they can be read to Power BI from GA4.

