Blog
How to read Norwegian krone (NOK) exchange rate data to Power BI
In this blog post, we are going to explain how to read data from Norges Bank to Power BI. We have done so in one of our reports, available in our Portfolio. The report reads data from Norges Bank directly to Power BI. We do so by utilising their REST API, which provides open data. REST API stands for REpresentational State Transfer API, and it is a common way of structuring and accessing data in a programmatic way.
Sometimes, there can be security measures applied to the REST API. In the case of Norges Bank’s API, there are no security measures so the API is fully open. If you are an API developer and wants to earn money by providing an API, you typically make the users pay for access to the API, and security measures make it impossible to reach for non-paying users.
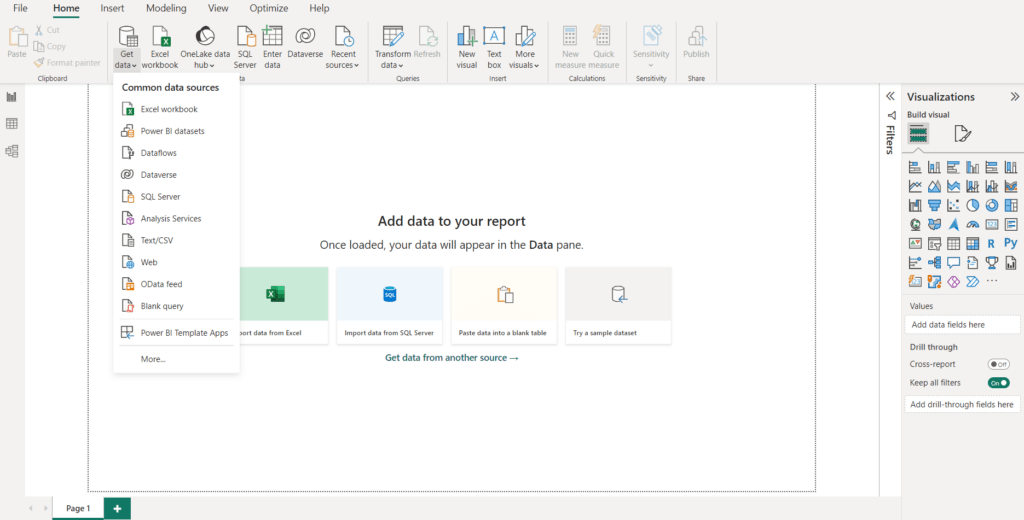
The user starts by going to Get Data in Power BI, which is going to look like this. Then the user selects “Web” in the list presented.
From Norges Bank’s website, we select that we want to read the USD exchange rate from 1st January 2023 until 24th January 2024. We also select that we want to read by API, and we then get the following message.
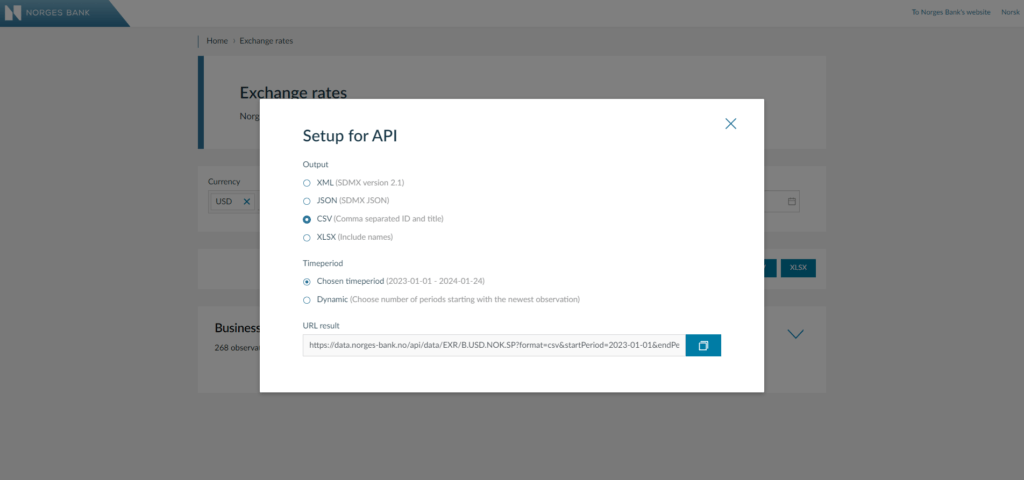
The URL listed is:
https://data.norges-bank.no/api/data/EXR/B.USD.NOK.SP?format=csv&startPeriod=2023-01-01&endPeriod=2024-01-24&locale=en
Here, EXR means Exchange rate and USD.NOK means that we want to read the USD-NOK exchange rate. We have selected a csv format and the start period and end period are visible in the URL. We simply add this URL to the URL field in Power BI which will look like below.
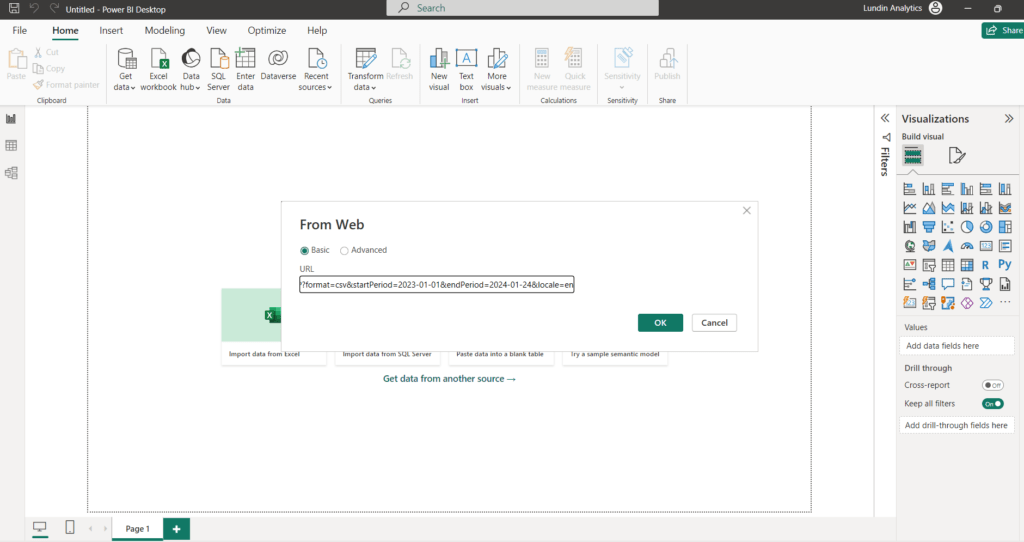
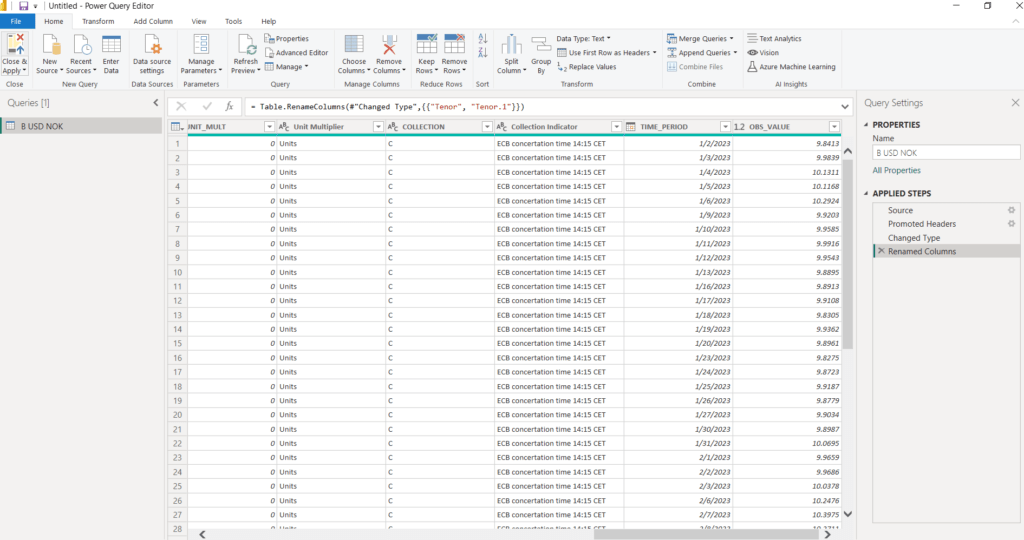
The user now gets the data from January 2023 in return. Each row of the data is the data for that day, in this case it is the exchange rate at that day.
Depending on the use case, it might be better to formulate requests that do not read all the data at once. For example, the report can have a button to refresh data depending on user selection. Then the user might select 2015 – 2024, and that request can then be sent to the API. This can be a nice solution if there are many potential API requests. Instead of reading all of these, they can be created dynamically. For example, Norges Bank has a section in their data warehouse where they provide Norwegian government securities – Prices and yields. Here, there are many Securities which can be seen below.
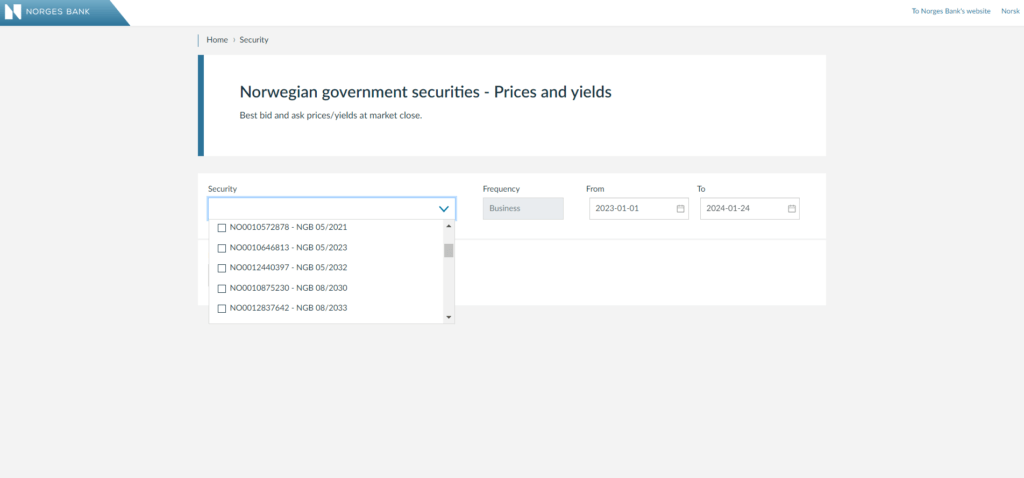
They can also be read with different Frequencies and Measurement units. It creates many combinations, so it can be a good idea to dynamically create such request depending on the user selection, rather than to pre-read all of them. In this report, however, it is straightforward and all the currency data is read from 2010.
Finally, the data will look like this in Power BI and now it is time to visualise the data in a meaningful way.
For more information on how Norges Bank shares open data, for example related to exchange rates, securities and interest rates, please see their website.

