On the development of SWESTR in March and Q1 2024
Blog
On the development of SWESTR in March and Q1 2024
We analyse the development of the Swedish krona Short-Term Rate (SWESTR) in March and Q1 2024. The SWESTR is a reference rate that can be used for setting rates between banks, and it is based on transactions happening in the financial market. We do the analysis with support from a Power BI report, which we have developed and which is available in our Portfolio. For more information on the SWESTR, please see our previous blog post or the Swedish central bank’s website.
March 2024 overview
We filter the Power BI report to only show data before the 1st of April 2024. We then see in the picture below an overview of the SWESTR development. As an example, we see that March and Q1 2024 ended with the SWESTR at 3.895%. From our blog post on the February development, we notice that this is the same as February, which also ended at 3.895%. The SWESTR has increased by 1.005% points compared to one year ago.
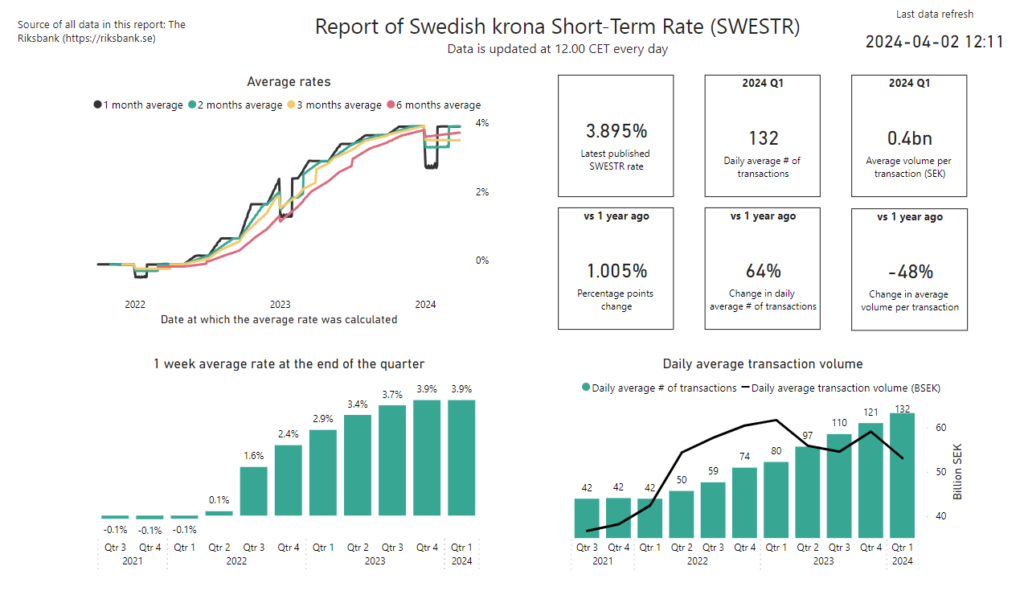
The chart in the upper-left corner presents averages calculated over 1 to 6 months. We see that all averages are slightly below 4%, just like we concluded in the February blog post.
SWESTR trend
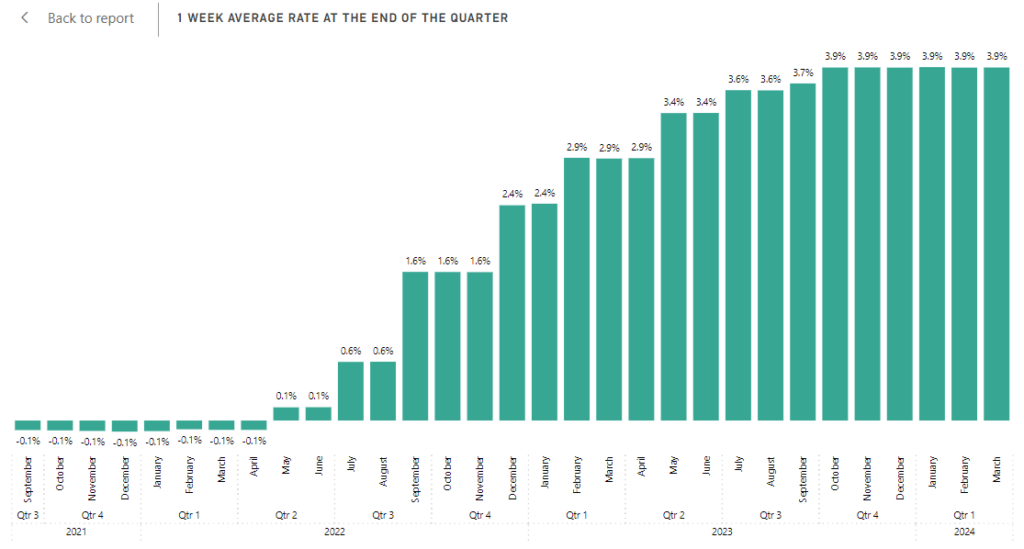
In the bottom left chart, in the picture above, we see that the rate with which the SWESTR increases, has slowed down. At the end of Q1 2024, the SWESTR was at 3.9%, and it was unchanged compared to the end of Q4 2023.
To further review the trend over time, we zoom in on the development per month. We then see that 6 months in a row have ended at 3.9%. The policy rate was increased from 3.75% to 4.00% from the 27th of September 2023. After that increase in September, there has been no change to the policy rate so the SWESTR is aligned in that sense. However, it is 10 bps lower at approximately 3.90%.
Number of transactions and SWESTR volume
We also review the number of transactions and the SWESTR volume in monetary terms. First, we note from the summary picture above, that Q1 2024 had on average 132 transactions happening per day. That was an increase from 80 in Q1 2023 – a 64% increase. The average transaction volume per day decreased from 61.72 BSEK in Q1 2023 to 53.06 BSEK – a 14% decrease and approximately 8.7 BSEK lower volume per day. That is a significant decrease in volume.
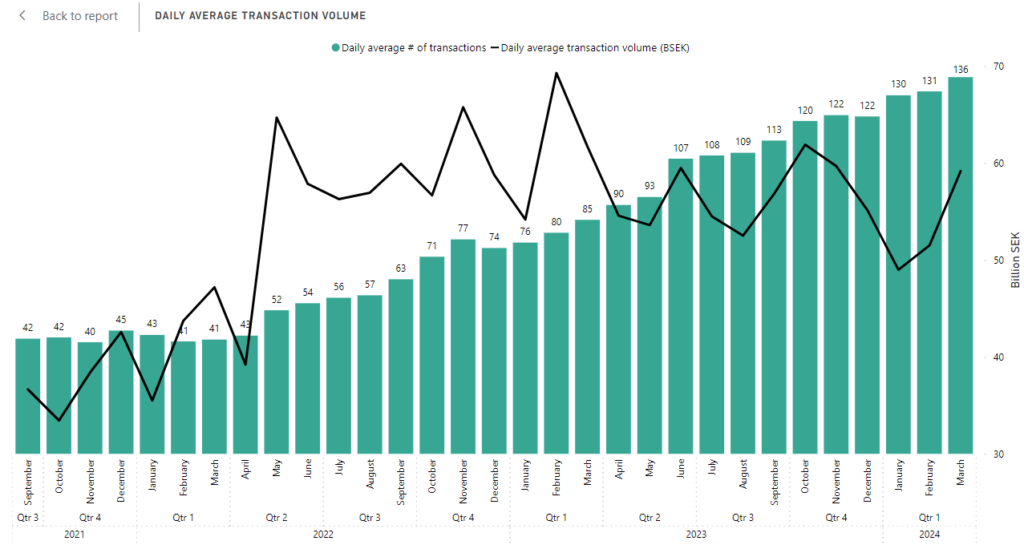
In the chart below, we zoom in on the development of daily number of transactions and daily average volume per month. We see that there is a clear trend where the number of transactions per day is increasing, and there were on average 136 transactions per day in March 2024. Ignoring the first months after the launch, the volume goes up and down between approximately 50 BSEK and 65 BSEK per day. It can be concluded that there are more, but smaller, transactions happening per day now compared to before.
Summary
The SWESTR has remained flat for 6 consecutive months around 3.9%. There are more and more transactions happening each day with the SWESTR – in March on average 136 per day, which is an increase by 61% compared to March last year. At the same time, the average daily volume was 59.2 BSEK in March, which is a decrease by 4% compared to March last year.
More blog posts
On the development of SWESTR in March and Q1 2024 Read More »

