On the development of the SWESTR in February 2024
Blog
On the development of the SWESTR in February 2024
We analyse the development of the Swedish krona Short-Term Rate (SWESTR) in February 2024. The SWESTR is a reference rate that can be used for setting rates between bank, and it is based on transactions happening in the financial market. We do the analysis by using a Power BI report, which is available in our Portfolio. For more information on the SWESTR, please see our previous blog post or the Swedish central bank’s website.
Overview
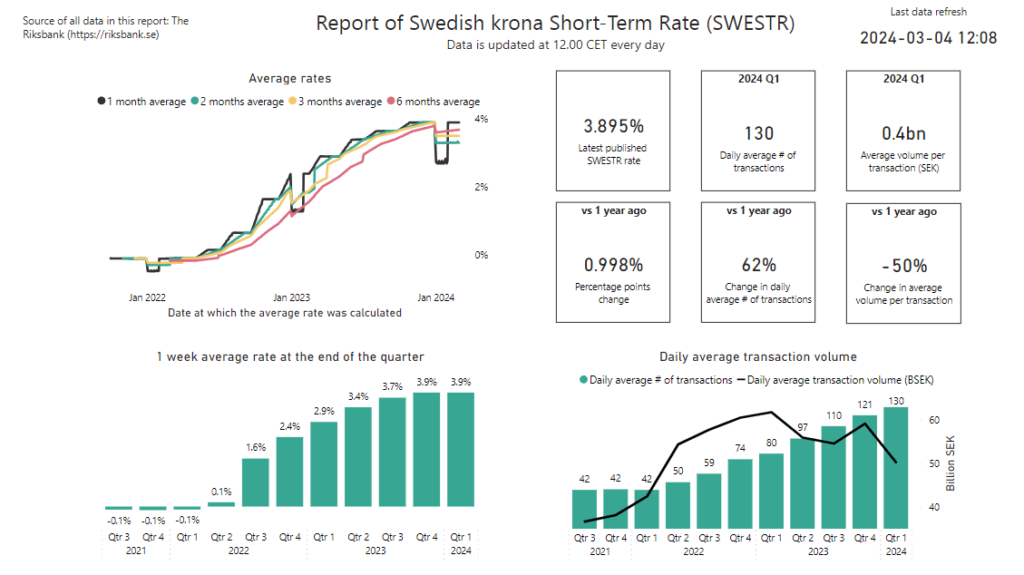
We start by filtering the Power BI report so that it only considers data before the 1st of March 2024, which is an option only accessible to us as report creators. We then see in the page below that the last published SWESTR is 3.895%, which was published at the 29th of February. That is an increase of 99.8 bps compared to one year ago.

The chart in the upper-left corner presents averages calculated over 1 to 6 months. We see that all averages are slightly below 4%. We also see clearly that the SWESTR has increased steadily since its launch in 2021.
The SWESTR trend
In the bottom-left chart above, we see that the rate with which the SWESTR increases, has slowed down. Since Q4 2022, the increases measured at the end of each quarter, have been:
- Q4 2022 to Q1 2023: 0.5%
- Q1 2023 to Q2 2023: 0.5%
- Q2 2023 to Q3 2023: 0.3%
- Q3 2023 to Q4 2023: 0.2%
- Q4 2023 to 2024 YTD: 0.0%
To further review the trend over time, we can zoom in on the development per month. We then see that 5 months in a row have ended at 3.9%.

Number of transactions and SWESTR volume
Finally, we review the number of transactions and the SWESTR volume in monetary terms. First, we note in the overview picture above, that so far in Q1, there are on average 130 SWESTR transactions happening per day. That is an increase by 62% compared to the same quarter last year. On the other hand, we see that the average volume per transaction is 0.4 billion SEK, which is a decrease by 50%. So, there are more transactions happening but the transactions are smaller on average.
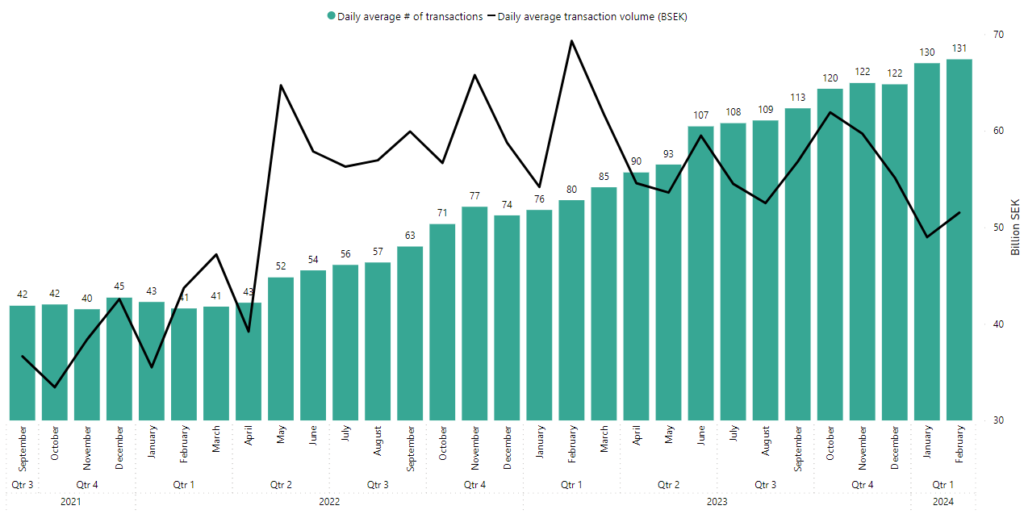
In the chart below, we zoom in on the transaction and volume development per month. There is a clear trend where the average number of transactions per day is increasing.

For February specifically, the average volume per day was 51.5 billion SEK – a decrease by 26% year-over-year. Similarly, the number of transactions in February was at 131, which was an increase by 65% year-over-year. Compared to January, the daily number of transactions was approximately the same with just a 1% increase. The volume increased from 49.0 to 51.5 billion SEK – a 5% increase.
Summary
The SWESTR has remained flat for 5 consecutive months around 3.9%. There are more and more transactions happening each day with the SWESTR, as evidenced by the daily number of transactions clearly trending upwards. In February, there were on average 131 transactions per day, which is a 65% increase compared to February last year. At the same time, the average daily volume was 51.5 billion SEK, which is a decrease by 26% compared to February last year.
More blog posts
On the development of the SWESTR in February 2024 Read More »


