Analysing website performance using Power BI and Google Analytics
Blog
Analysing website performance using Power BI and Google Analytics
In this blog post, we will analyse website performance using Power BI and Google Analytics (GA4) data. We do so by using an existing report, which is available in our Portfolio, and it is called Website statistics. For information, we described in a previous blog post how to connect Power BI and Google Analytics.
Introduction of website analytics using Power BI and Google Analytics
The report connects Power BI and Google Analytics, and we are using the GA4 connector to do so. It is a rather simple report with just one page, and the purpose is to show effectively a snapshot of the most important website metrics. Using the Power BI online service, we have set up automatic refreshing of the GA4 data. For more information about Google Analytics, we refer to this page.
The default view presents the performance in the Current month, but it is possible to go back in time to review the month of interest. We measure the following metrics:
- Sessions
- Bounce rate
- Hits
- Visitor type
- Visitor source
- Seconds spent per page
They are visualised from different perspectives, for example, the sessions can be seen per day and per city and they are also compared to the last month.
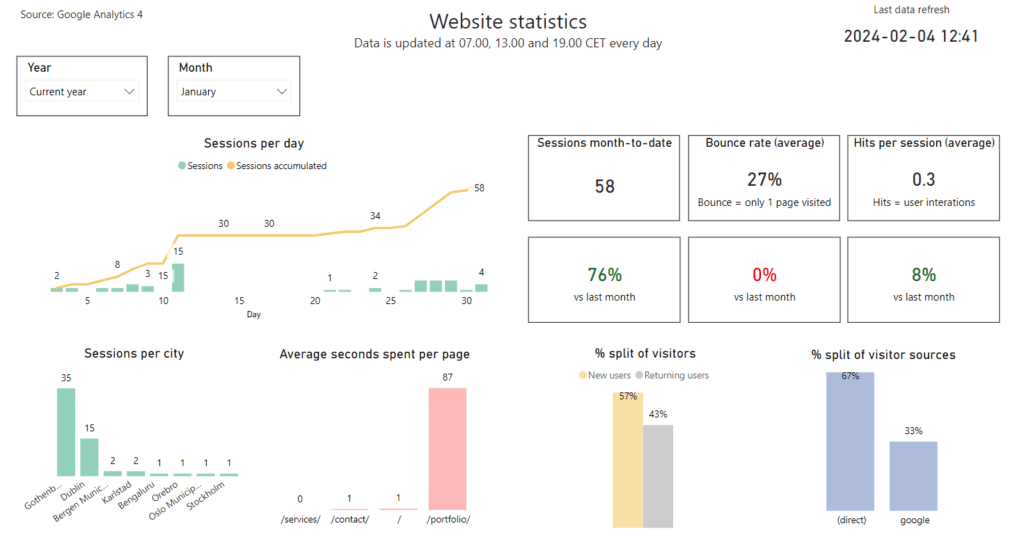
Quick introduction of the measured metrics
We will here go through the interpretation of the metrics used in the report and justify why they are measured.
Sessions is the most basic website metric, and basically measures all traffic coming to your website. It is the starting point of all website analytics.
Bounce rate means that only one page is visited for a specific session. Typically, it is desired to keep the visitor engaged and have the visitor visit multiple of your pages. We measure this because we want to ensure our full website content is shown to the visitor.
Hits measures the number of user interactions. For example, a user clicking on the link to another page would imply one hit. Similarly to bounce rate, we want to ensure that our content and message are displayed to the visitor.
Visitor type measures if it is a New user or an Existing user that is coming back to your site. This is important to measure, because it needs to be aligned with your business intentions. For example, if you want to attract new customers, you would like to see New users visiting the site.
Visitor sources measures from where the traffic originates. For example, direct means that the visitor knows your URL and has visited your site directly. This is an important metric as it shows how well your marketing campaigns and marketing outreach are working.
Analysis
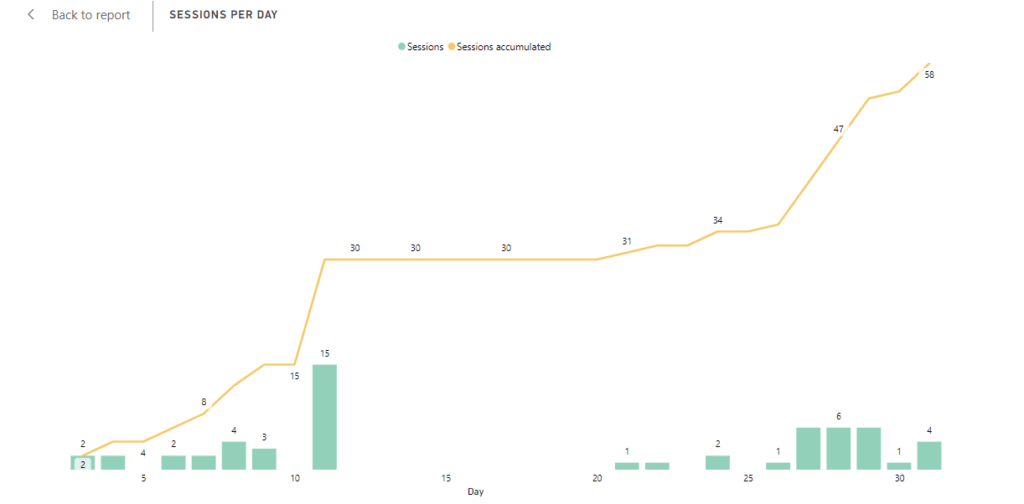
In this chart, we see the number of sessions for each day. With the line, we are also able to see the accumulative number of sessions throughout the month. For example, we see that approximately from day 11 to day 20, there was no traffic at all.
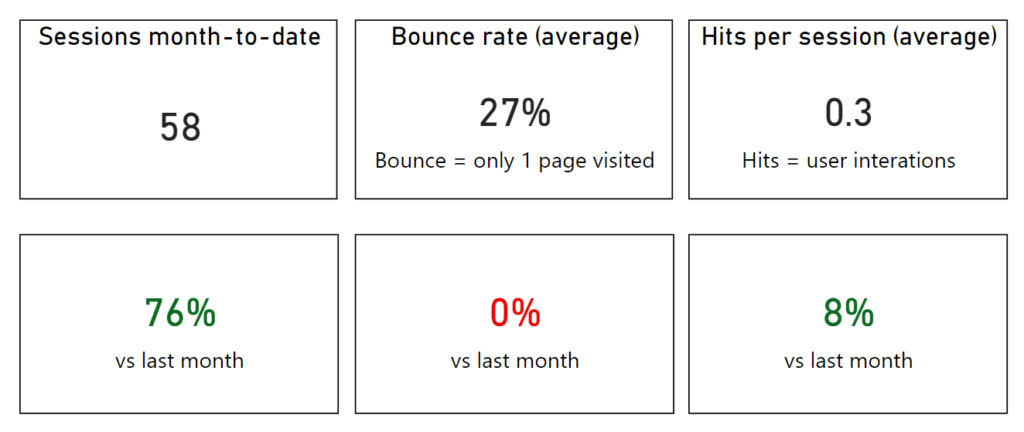
We present three high-level KPIs and compare them to the last month. The first KPI is the number of sessions which were up by 76%, compared to the last month, which is a large change. Then there is the bounce rate, which means that in the month, on average, 27% of the sessions only had one page visited. Ideally, here we would like to see a low %, as we would like the user to visit several pages. Then, we see with the hits, that on average 0.3 user interactions happened per session. This was an increase by 8% compared to the last month.
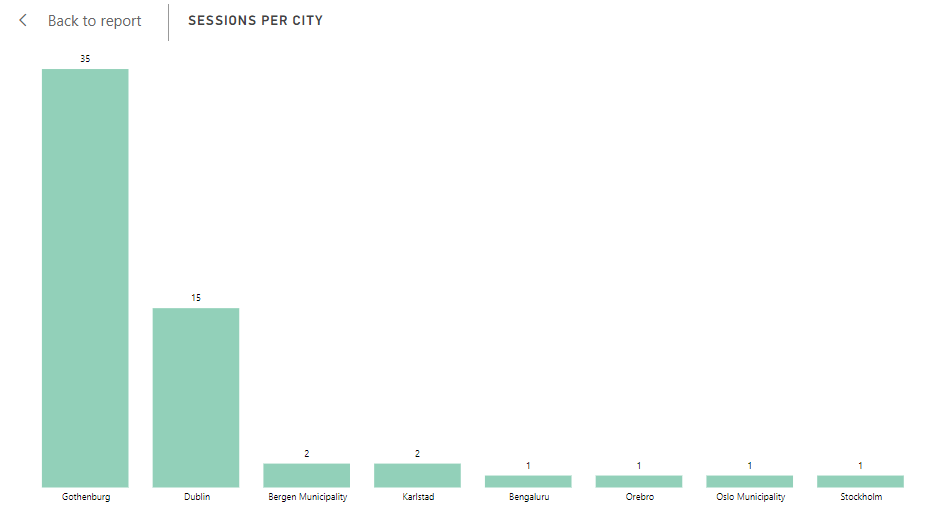
If we then move on to more in-depth KPIs, we see a distribution of the sessions by the city they originated from.
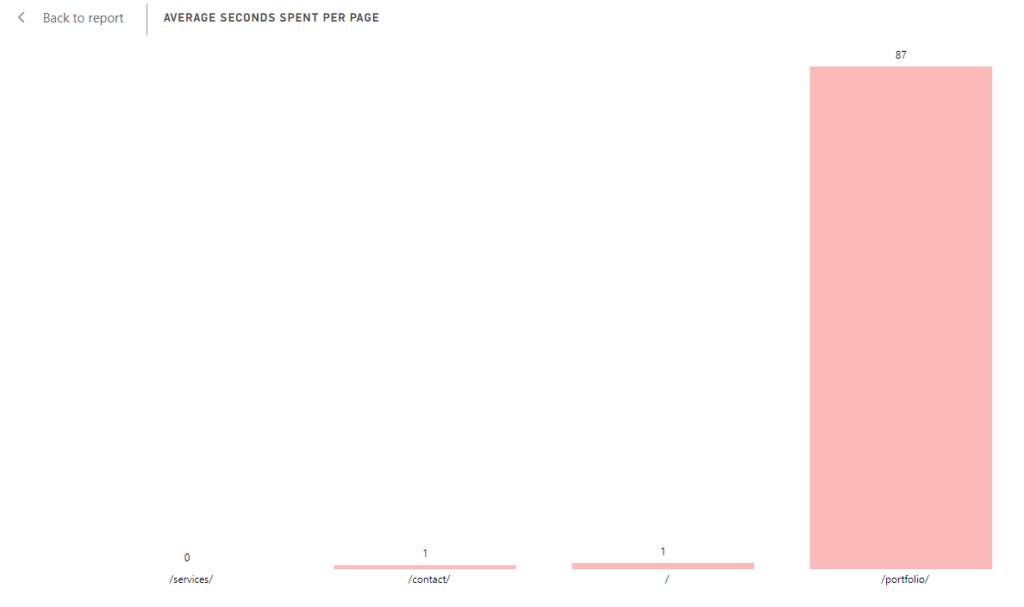
When reviewing where visitors spend their time, we see that the Portfolio page was, by far, the page that the visitors spent the most time at.
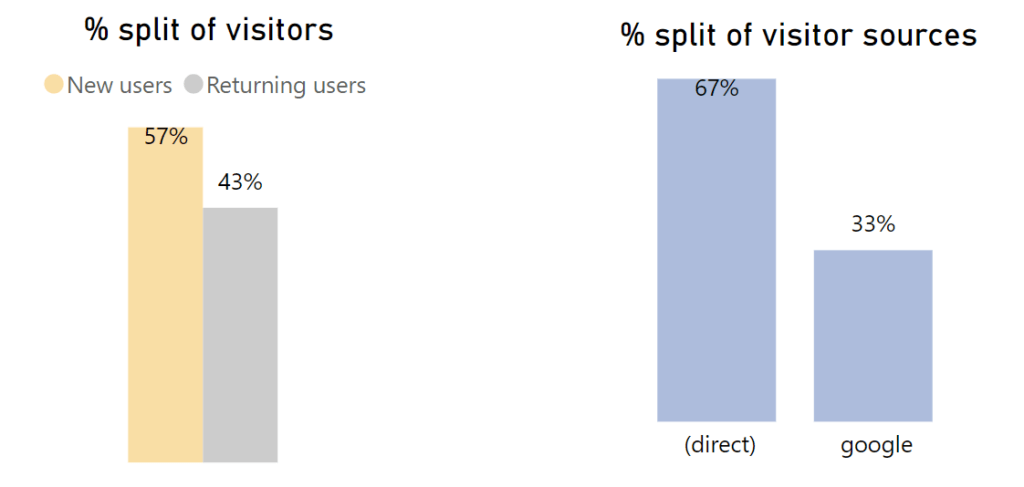
Next, we see that 57% were New users and 43% were Returning users. We consider this a healthy balance, but it also is very specific for each site’s business intentions. We also see that we had two types of traffic sources – direct and via Google, where direct traffic dominated at 67% of all traffic.
Summary
We used a Power BI report to analyse website performance. In addition, we looked at common website metrics like sessions, visitor types, visitor sources etc. and learnt why they are important to measure. By using Power BI and Google Analytics data together, we can tailor our analysis exactly how we want it, but there are also possibilities to use other tools, like the built-in charts in Google Analytics’ web tool.
More blog posts
Analysing website performance using Power BI and Google Analytics Read More »

