How to read data from Google Analytics to Power BI
Blog
How to read data from Google Analytics to Power BI
In this blog post, we will learn how to connect Google Analytics to Power BI, using the latest version of Google Analytics called GA4. For information, we discussed in a previous blog post how to connect Power BI to a database using a REST API. Google Analytics uses another technology, however, which we will go through here. The post assumes that you have a Google account set up, and that you are tracking statistics for your website.
Introduction to Google Analytics
Google Analytics is a popular tool for analysing traffic on websites. More specifically, it is possible to track user behaviours on your website and learn more about how your content caters to your audience. For example, you can see how certain pages perform in terms of making the user stay at the page. You can then learn which type of content performs well. It is also possible to see from which country and city that your traffic originates from.
You can also see how much your users interact with your website. For example, if much of your traffic only arrives at the start page and then have no further interactions, it could indicate some problems with your website. It could also mean that it is very important that you optimise your message to be shown efficiently on that start page.
It is also possible to see if the traffic originates from new visitors or previous visitors. Again, this could impact how you want to position your content, what content you shall develop and it could infleunce your marketing strategies as well. For example, if your traffic only consists of previous visitors, it could indicate that you need to attract new visitors. Here is some further information on Google Analytics in general.
Introduction to Google Analytics in Power BI
In order to connect to all the data that exists in the Google Analytics environment, there is a special connector developed for the purpose. There are two versions of the connector – 1.0 and 2.0 (Beta). The 1.0 version is related to a previous Google Analytics version called Universal Analytics. In 2023, Google released its new version called Google Analytics 4 (GA4). The version called 2.0 (Beta) supports GA4, so we will use that in our guideline. For more information on the Power BI connector, please see Microsoft’s website.
Connecting Google Analytics to Power BI
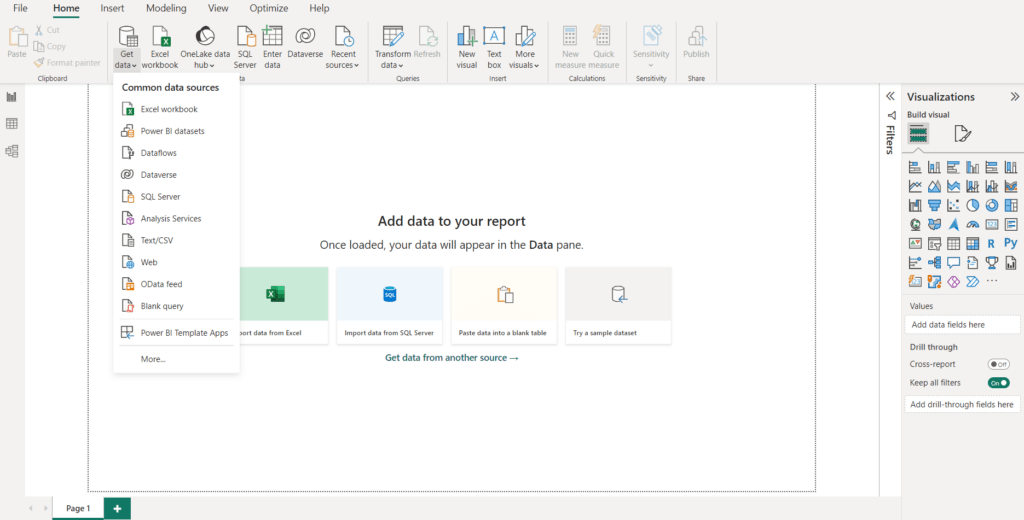
We start by opening Power BI and go to Get data. It will look like this, and then the user selects “More…”.
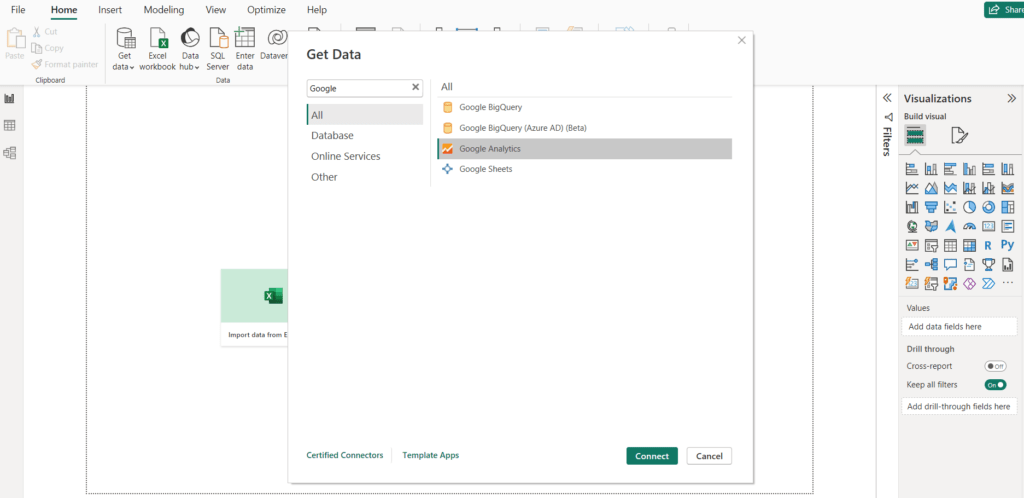
Then we search for Google, select Google Analytics and click on Connect.
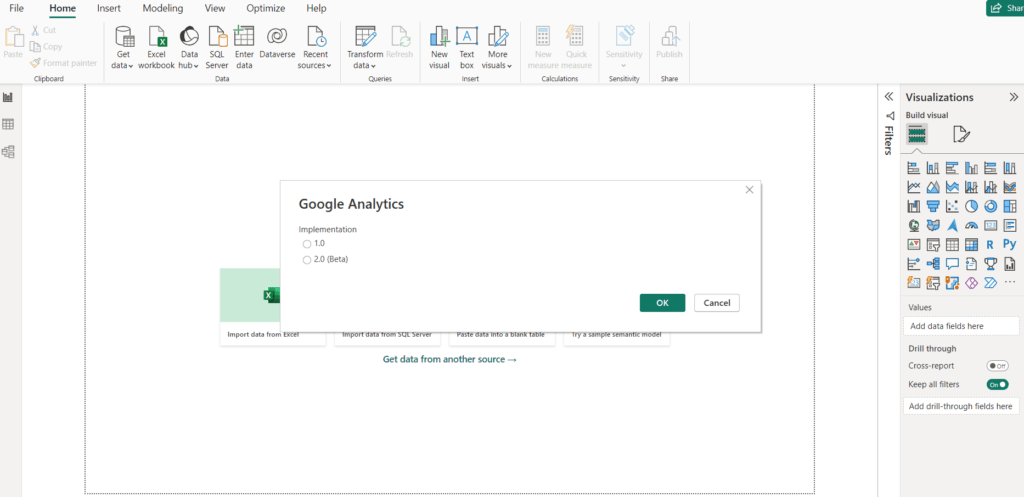
Next, we choose 2.0 (Beta) because we want to use the GA4 version of the connector.
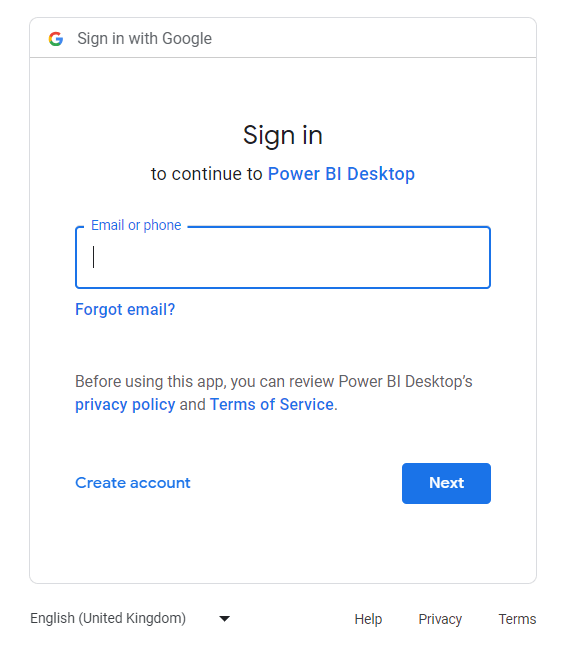
We then are asked to sign in to our Google account in the web browser.
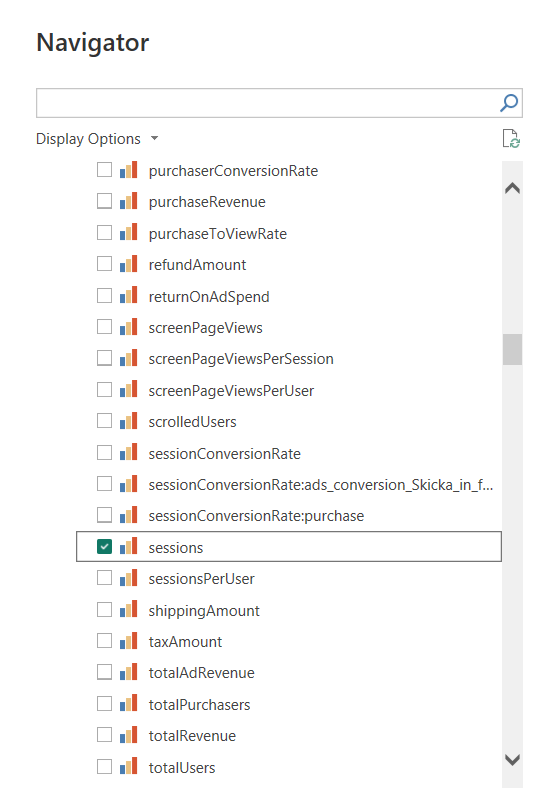
After having logged in, we are able to select from several KPIs and we can also select from which aspect we want to measure said KPIs. For example, we here select sessions which is one of the most basic measurements. Basically, sessions means all traffic (sessions) that have been appearing at your website. Next, we select that we want to measure sessions by date and country. This way, we will be able to see the traffic numbers for each day, and we can see how much of the traffic that originates from each country.
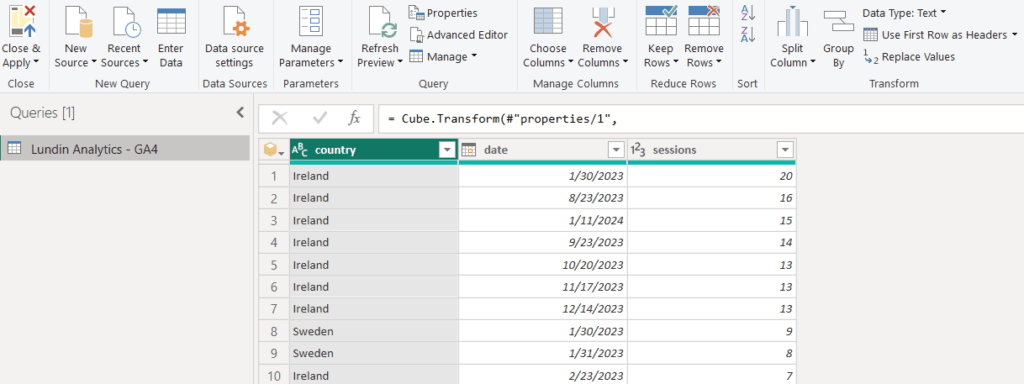
We click on Load, and the data will look like below. We can note that the data is shown in a summarised way. For example, it says Ireland and for a specific day, there were 20 sessions. This is a more efficient way than showing each session specifically. However, as we bring in more dimensions, we will get more columns and rows of data which will impact performance. For example, if we are to add city, perhaps 5 sessions are from a certain city, 10 are from another city etc. So it would change the data structure.
It can be a good idea to think through what you want to analyse and from what perspective. Depending on how much web traffic data that your site has, what kind of data you want to read will influence the performance of the Power BI report. The Google Analytics connector in Power BI also has a limit of 10 KPIs per data query. A way to get around that is to have multiple queries, but with each KPI and query added the Power BI performance will be impacted. If your site focuses on keeping existing visitors, your analysis can start with reading much data related to existing visitors in one query. You can then complement it with other KPIs in a second query, for example.
Summary
In this blog post, we discussed some benefits of using Google Analytics 4 (GA4) data to analyse your website performane. We also learnt how to connect Google Analytics to Power BI, by using the built-in connector. More specifically, we learnt how to use the connector for GA4, which is the most recent version of Google Analytics. Finally, we reviewed some data and discussed what GA4 data is relevant to analyse and some limitations of the GA4 connector.
More blog posts
How to read data from Google Analytics to Power BI Read More »

